Office Space
7110 East Brainerd Road Chattanooga, TN 37421
7110 East Brainerd Road Chattanooga, TN 37421
Details & Description
Property Highlights
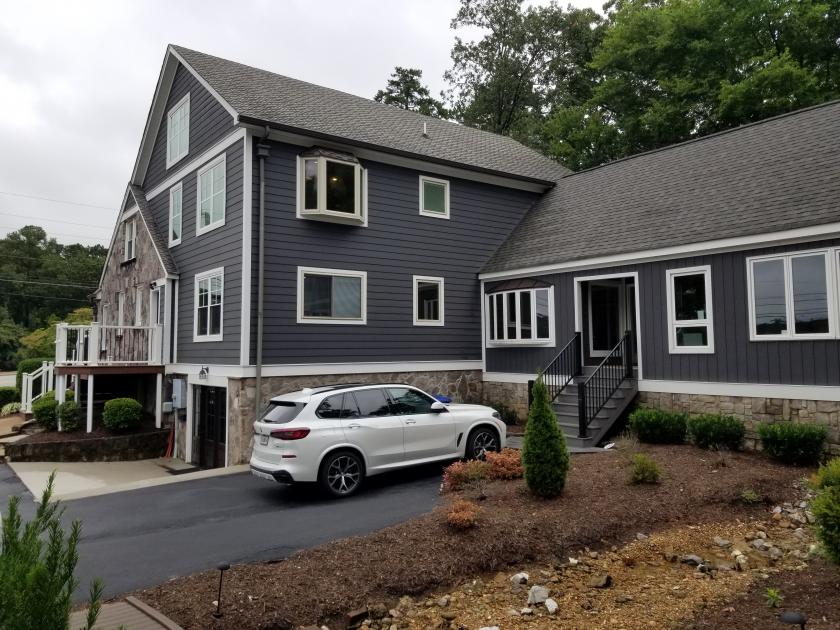
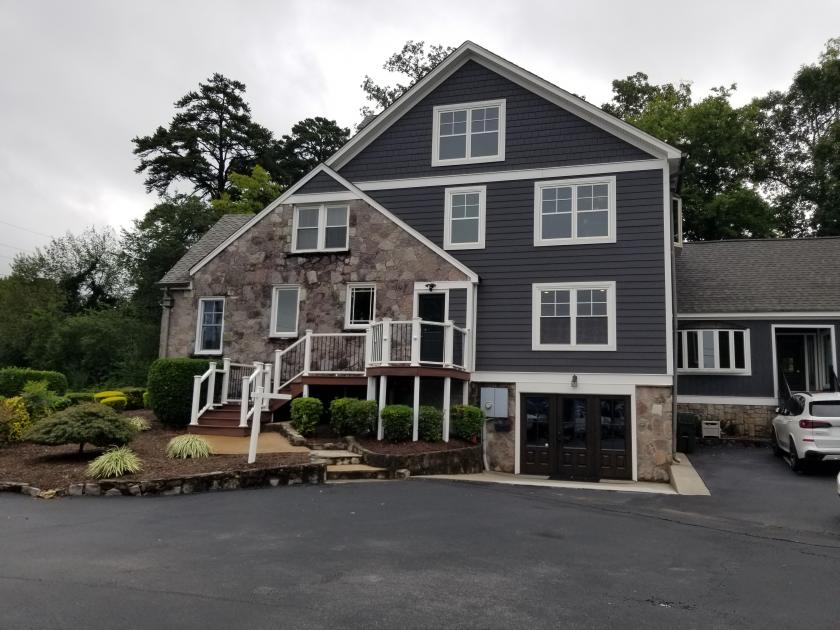
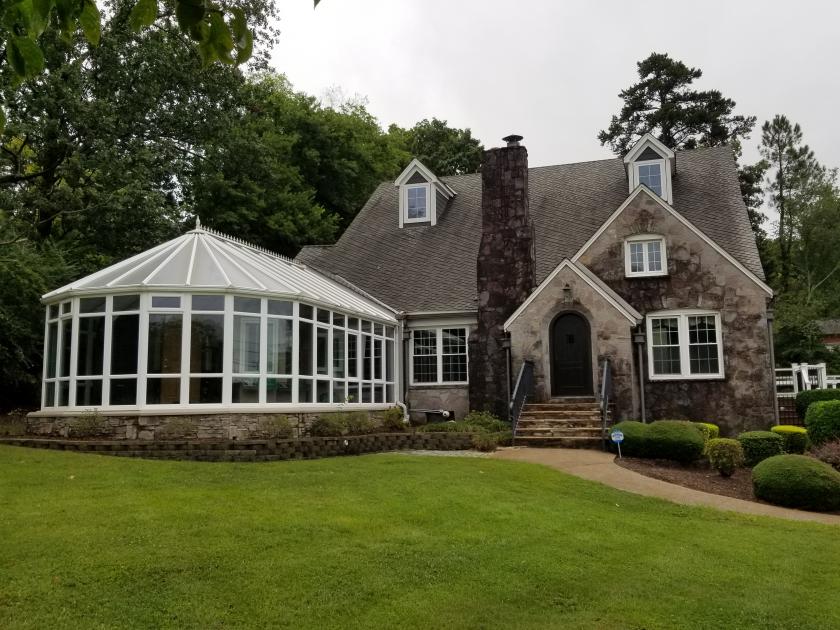
• Beautiful East Brainerd OfficeMedical Building at I-75
• Beautiful East Brainerd OfficeMedical Building at I-75
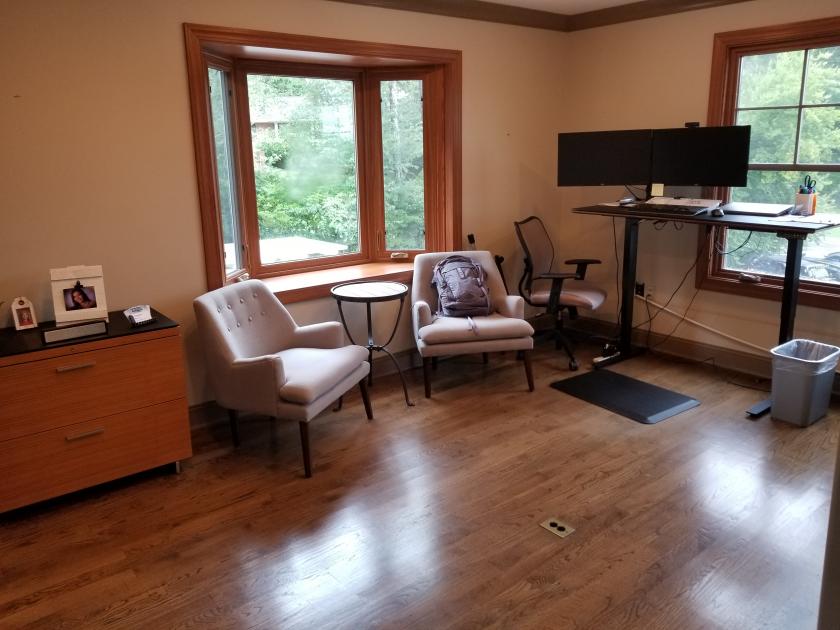
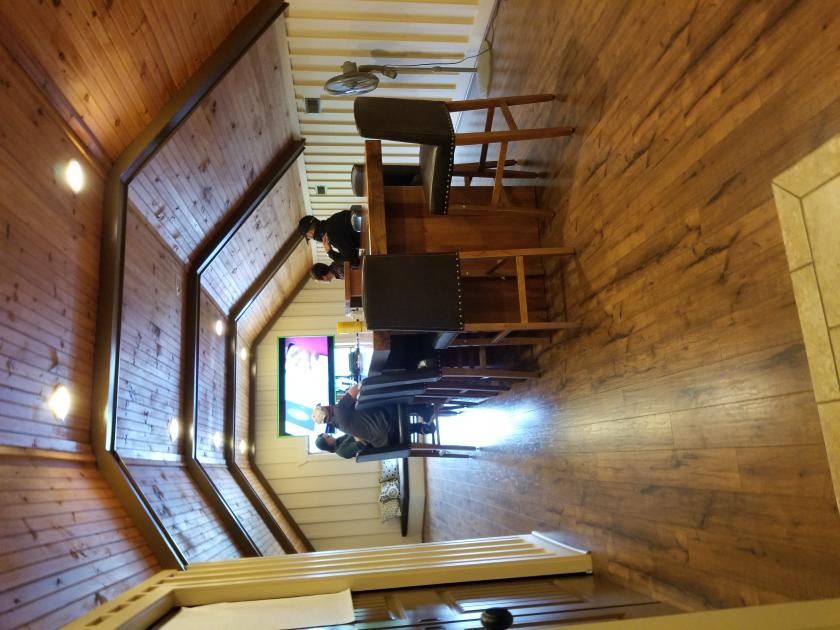
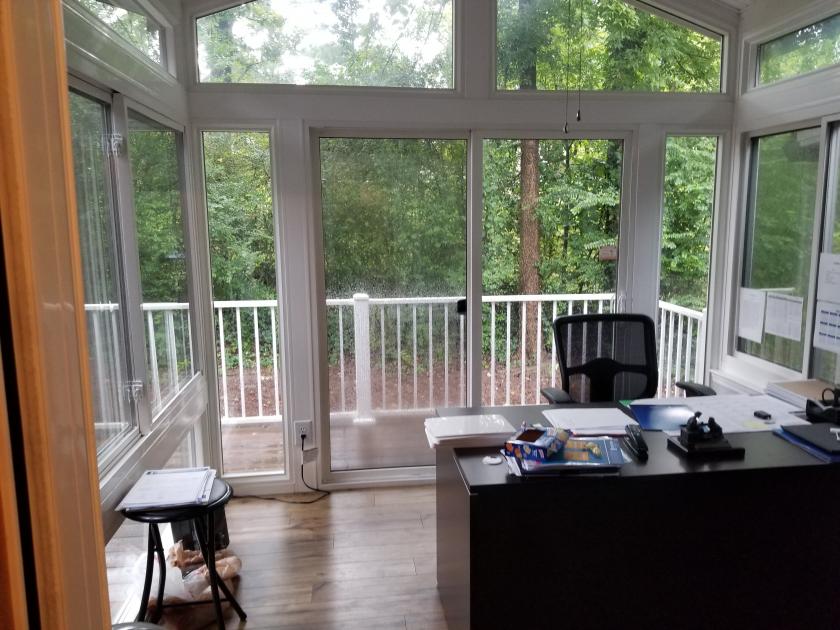
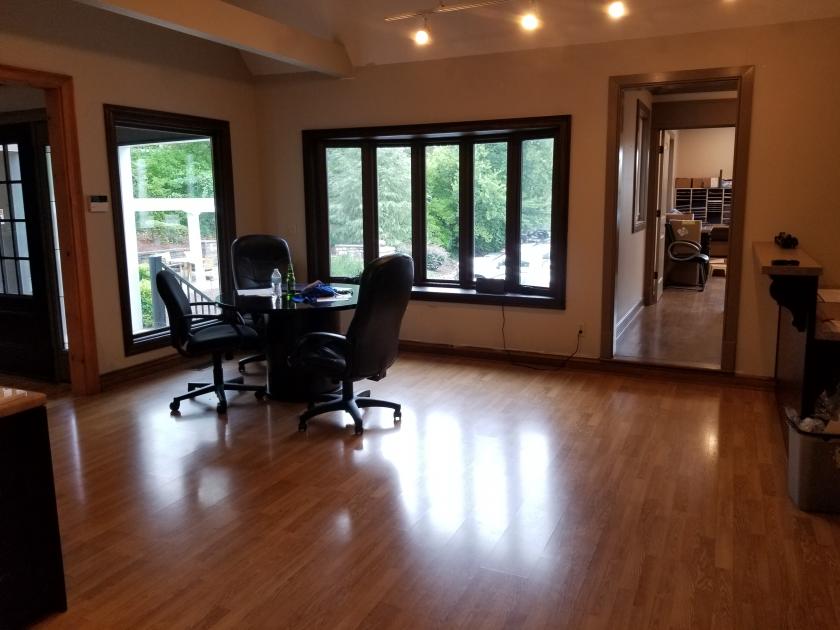
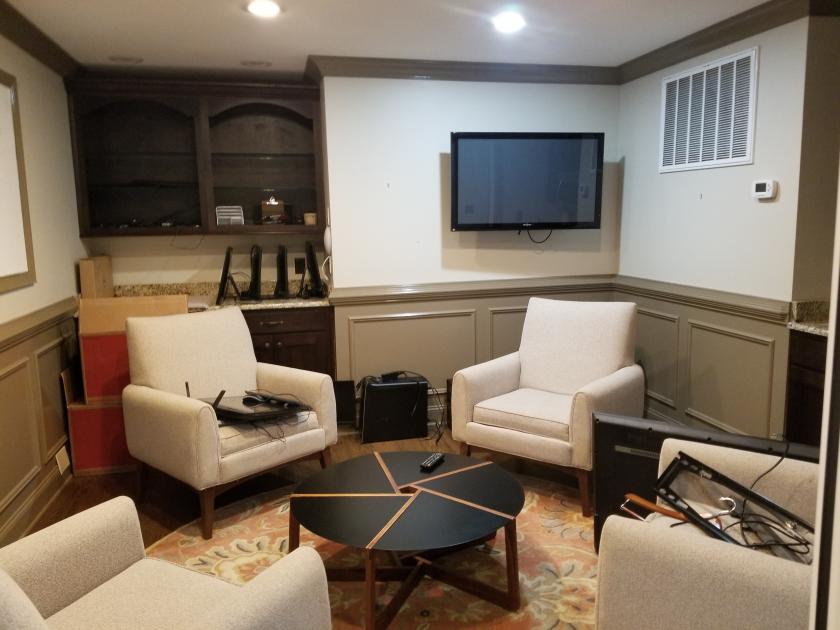
Additional Photos

Listing Agents

Heather Bevil
O: 423-800-8003
M: 678-266-2024
heather@chattanoogacommercial.net
O: 423-800-8003
M: 678-266-2024
heather@chattanoogacommercial.net
While we strive to provide the most accurate information, all listing information, and demographic data, is provided by third-parties. As such, MyEListing will not be responsible for the accuracy of the information. It is strongly recommended that you verify all information with the listing agent, and any relevant agencies, prior to making any decisions.