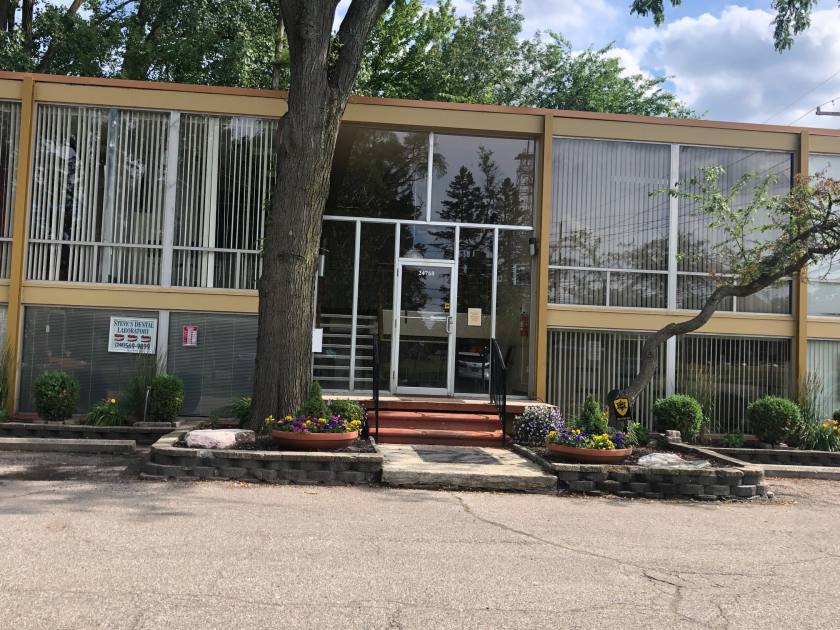
Office Space
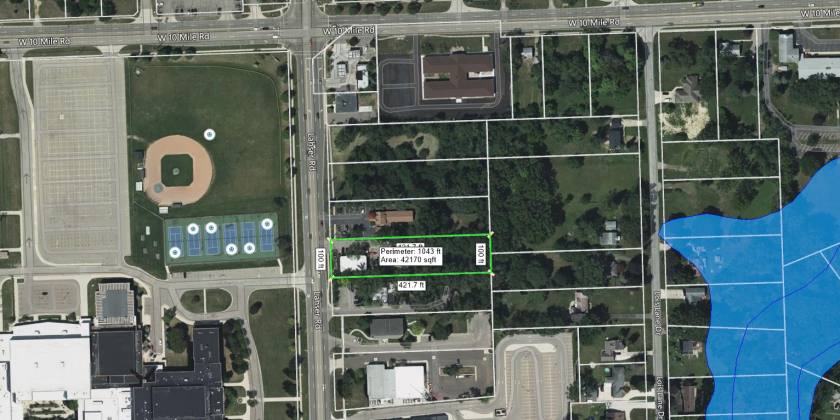
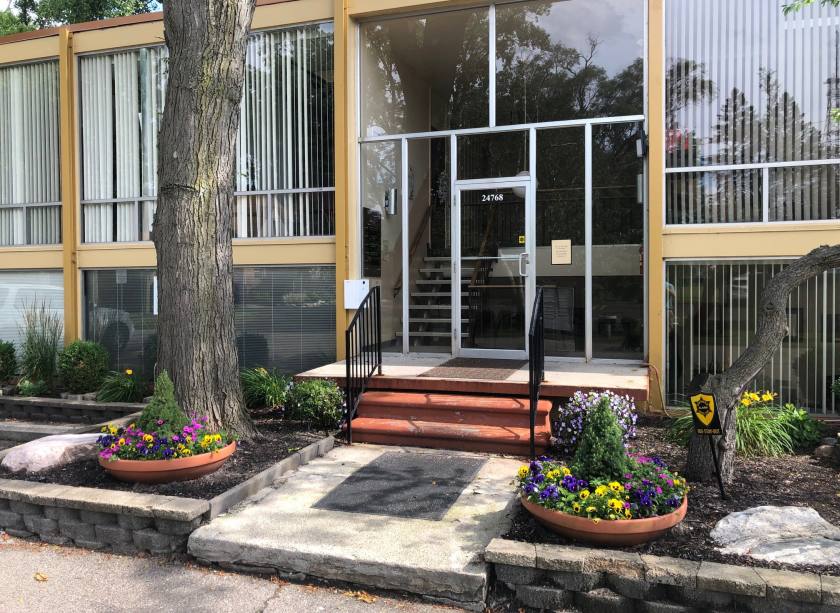
24768 Lahser Road Southfield, MI 48033
24768 Lahser Road Southfield, MI 48033
Details & Description
Property Highlights
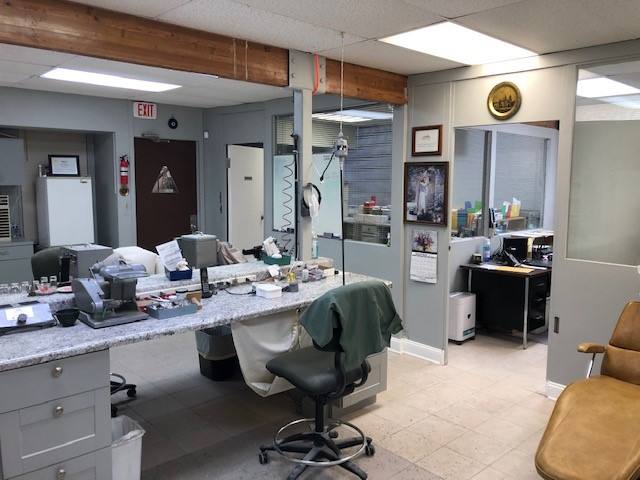
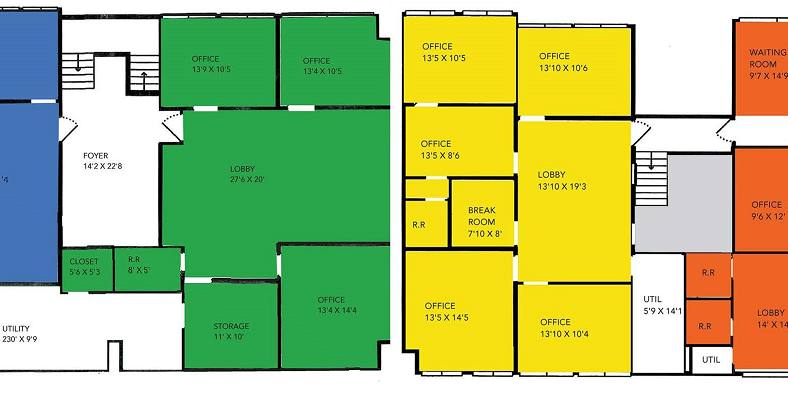
• Tenants include Driving school, dental lab, salon, insurance agent, real estate agent
• Fully occupied except for a single office in the shared suite
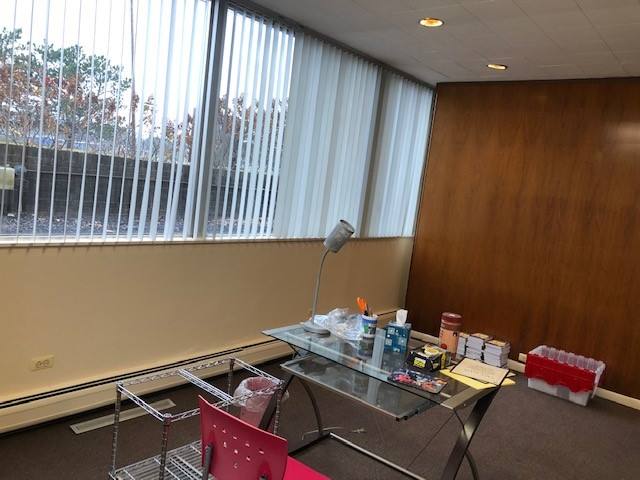
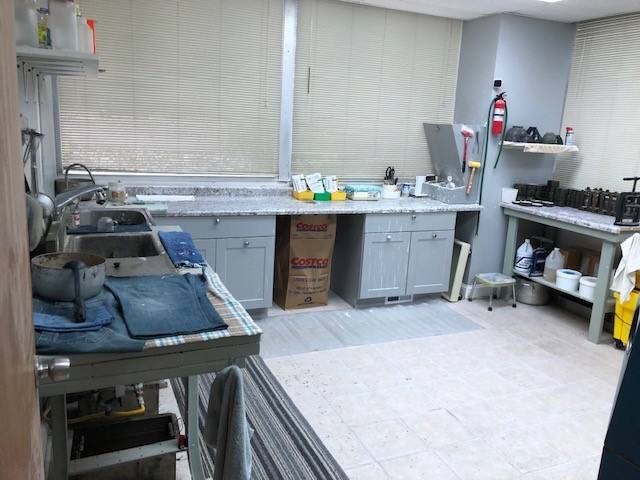
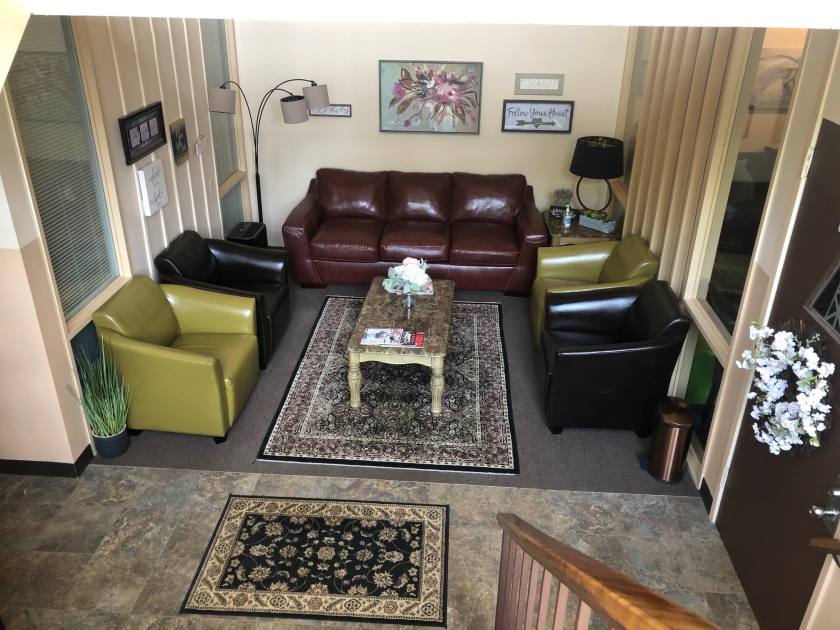
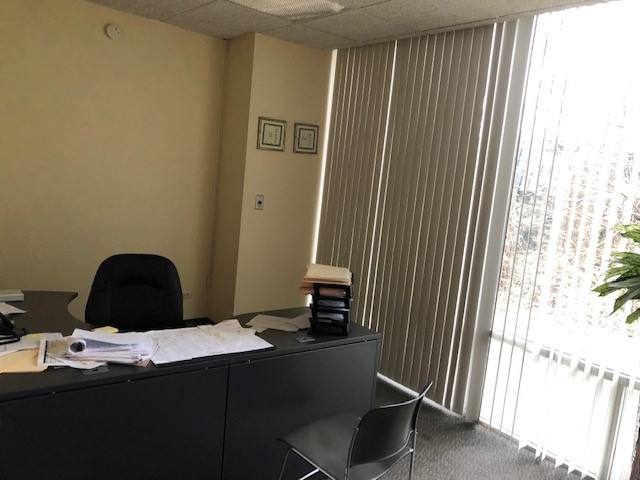
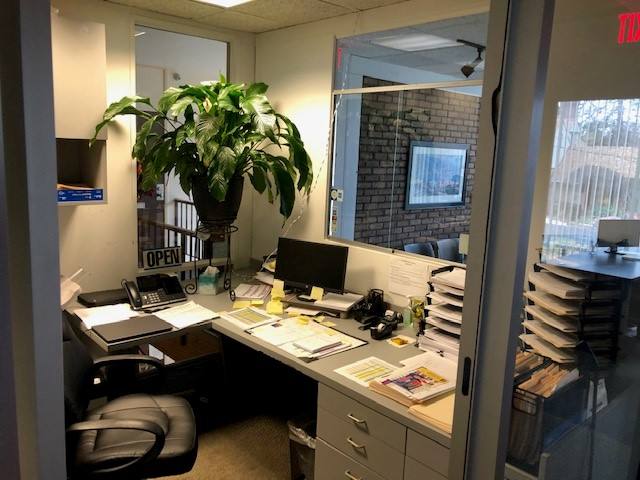
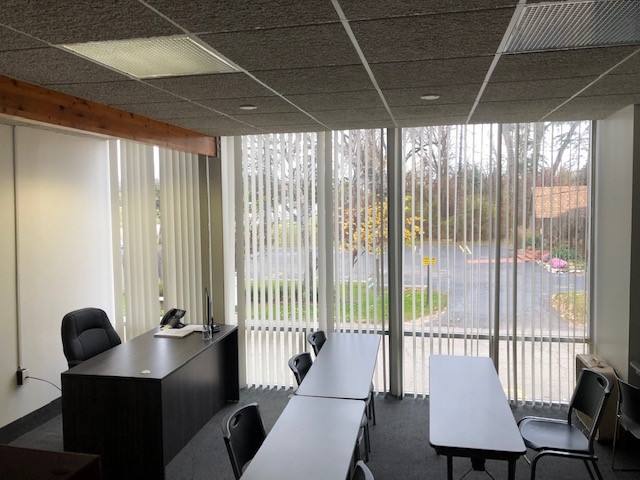
Additional Photos

Listing Agents

Charles Howard
O: 248-440-1447
charles.howard@transwestern.com
O: 248-440-1447
charles.howard@transwestern.com
While we strive to provide the most accurate information, all listing information, and demographic data, is provided by third-parties. As such, MyEListing will not be responsible for the accuracy of the information. It is strongly recommended that you verify all information with the listing agent, and any relevant agencies, prior to making any decisions.