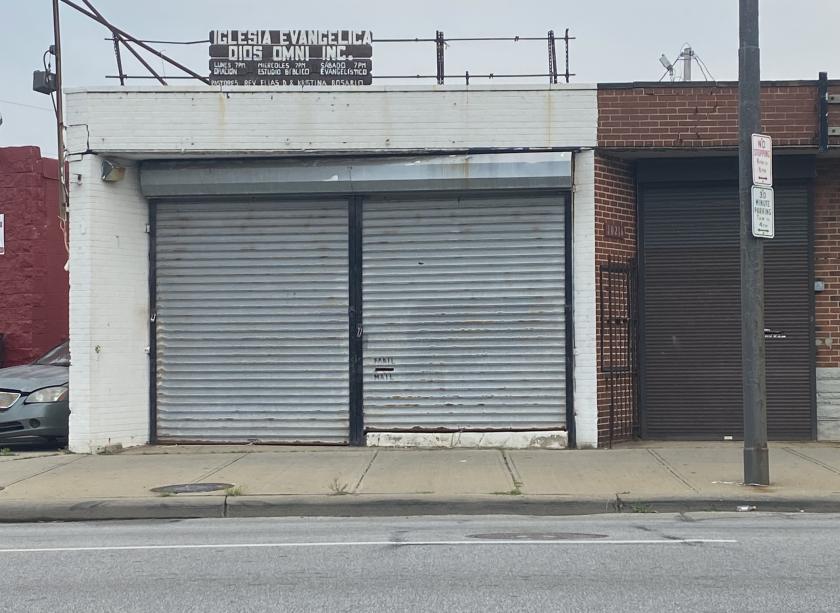
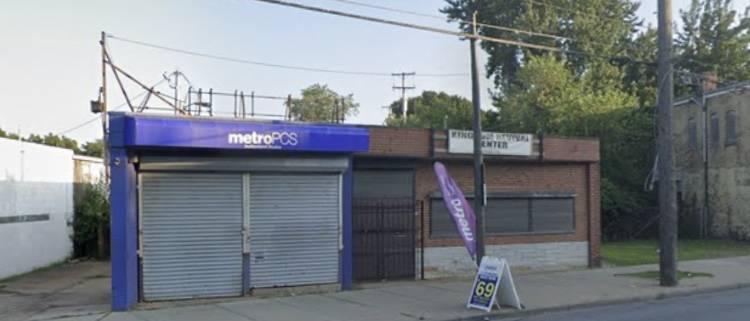
Retail Space
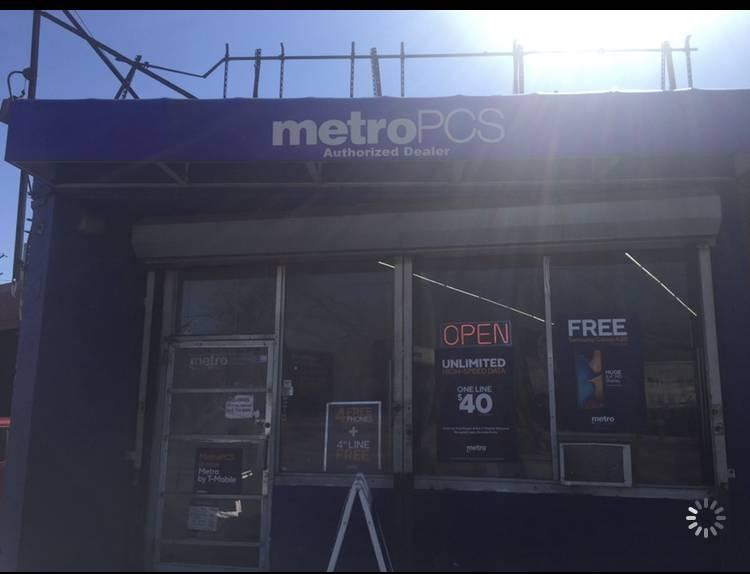
10218 Saint Clair Avenue Cleveland, OH 44108
10218 Saint Clair Avenue Cleveland, OH 44108
Details & Description
Property Highlights
- • Set up anything retail
- • Newly remodeled
- • Rent price is negotiable
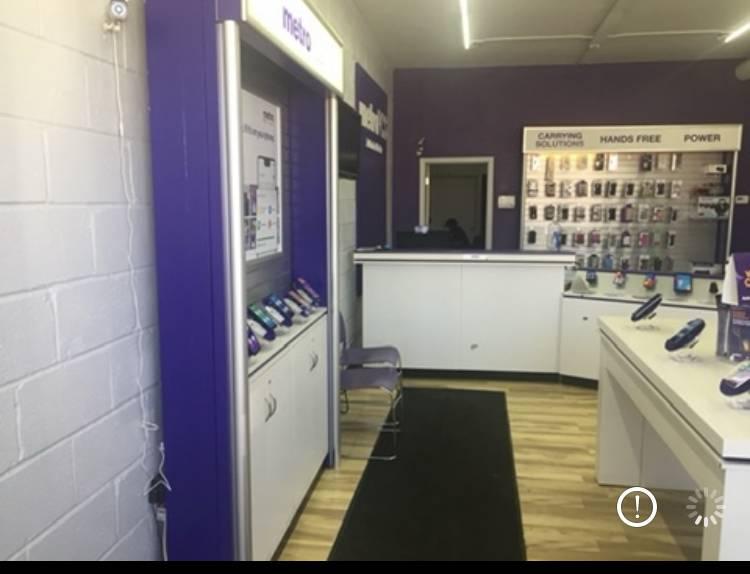
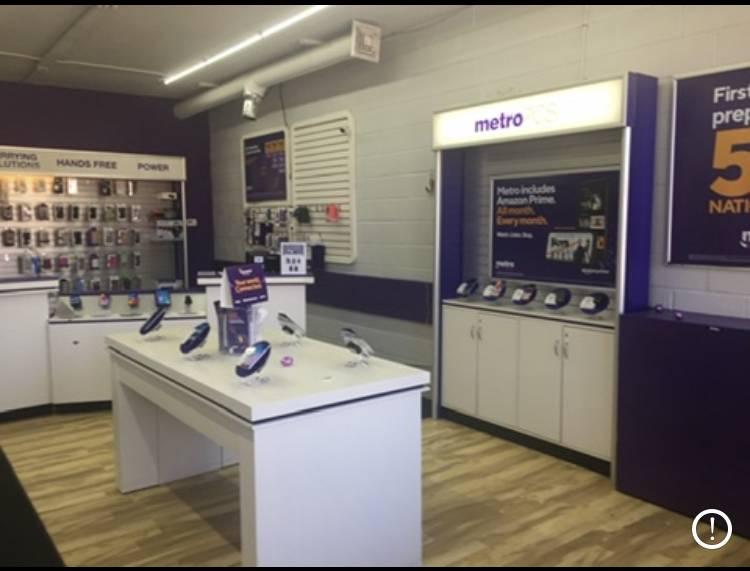
Additional Photos
Listing Agents

Taher Salem
salemsdx@yahoo.com
salemsdx@yahoo.com
While we strive to provide the most accurate information, all listing information, and demographic data, is provided by third-parties. As such, MyEListing will not be responsible for the accuracy of the information. It is strongly recommended that you verify all information with the listing agent, and any relevant agencies, prior to making any decisions.


