Specialty Real Estate
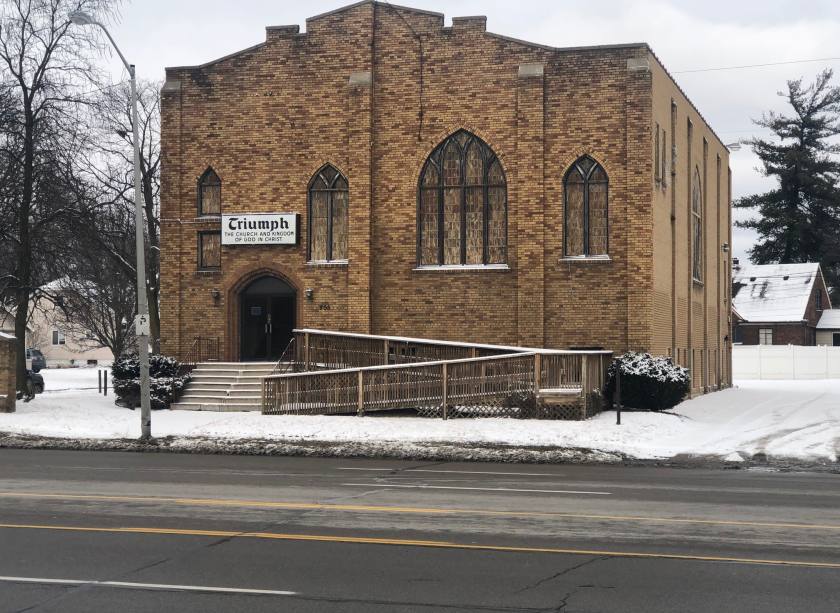
858 West Huron Street Pontiac, MI 48341
858 West Huron Street Pontiac, MI 48341
Details & Description
Property Highlights
• Possible multi-family retrofit
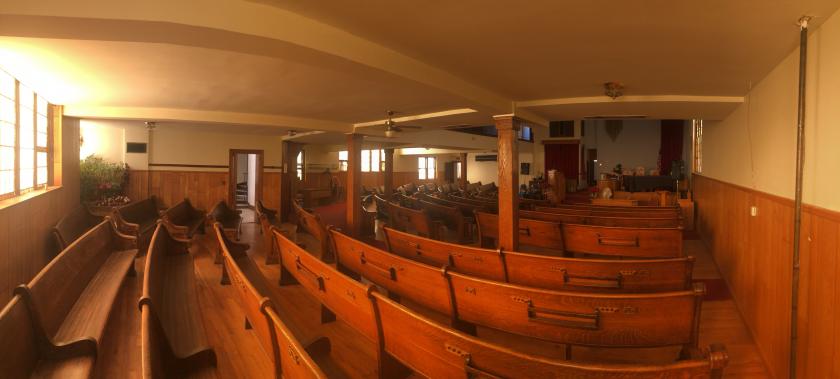
• Former church
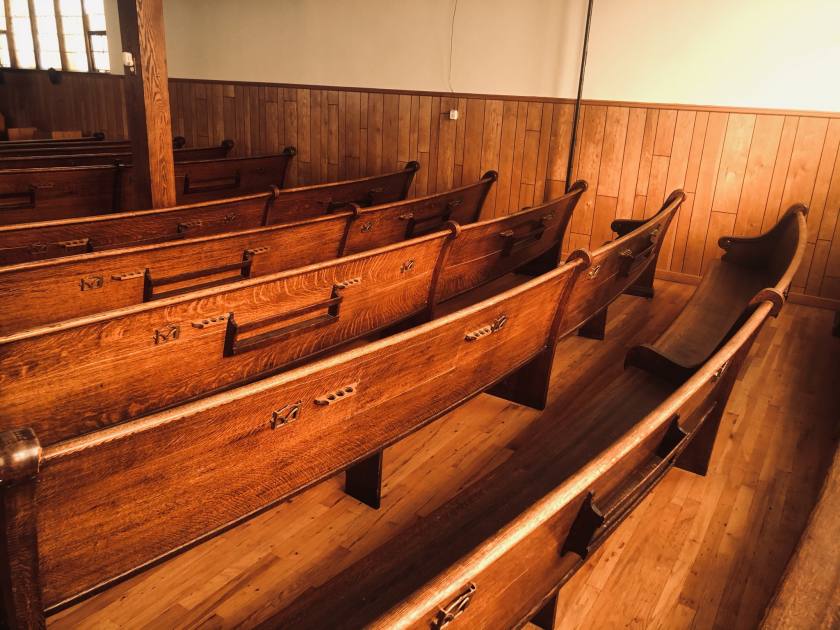
Additional Photos

Listing Agents

Charles Howard
O: 248-440-1447
charles.howard@transwestern.com
O: 248-440-1447
charles.howard@transwestern.com
While we strive to provide the most accurate information, all listing information, and demographic data, is provided by third-parties. As such, MyEListing will not be responsible for the accuracy of the information. It is strongly recommended that you verify all information with the listing agent, and any relevant agencies, prior to making any decisions.


