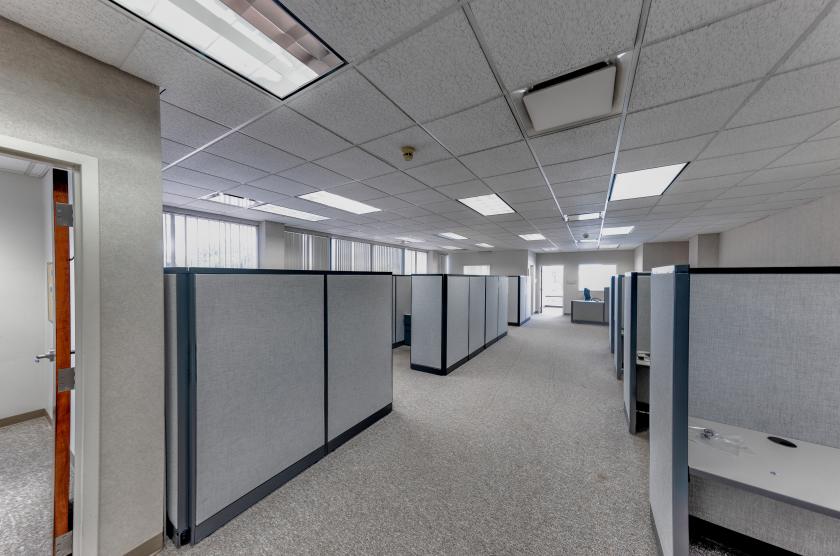
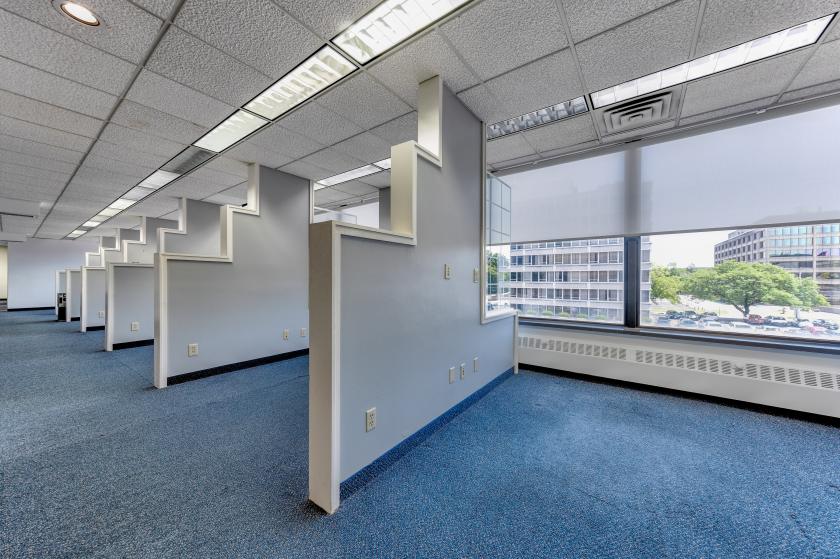
Office Space
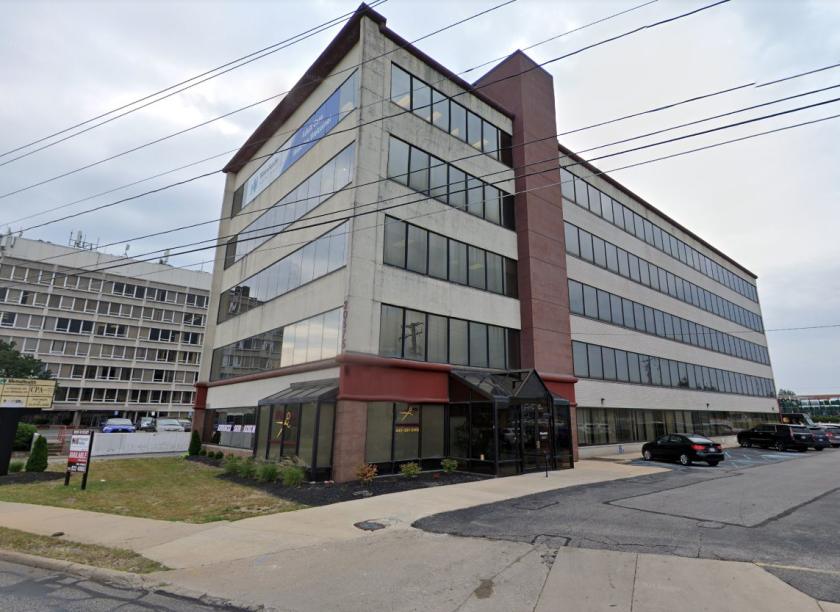
20575 Center Ridge Road Rocky River, OH 44116
20575 Center Ridge Road Rocky River, OH 44116
Details & Description
Property Highlights
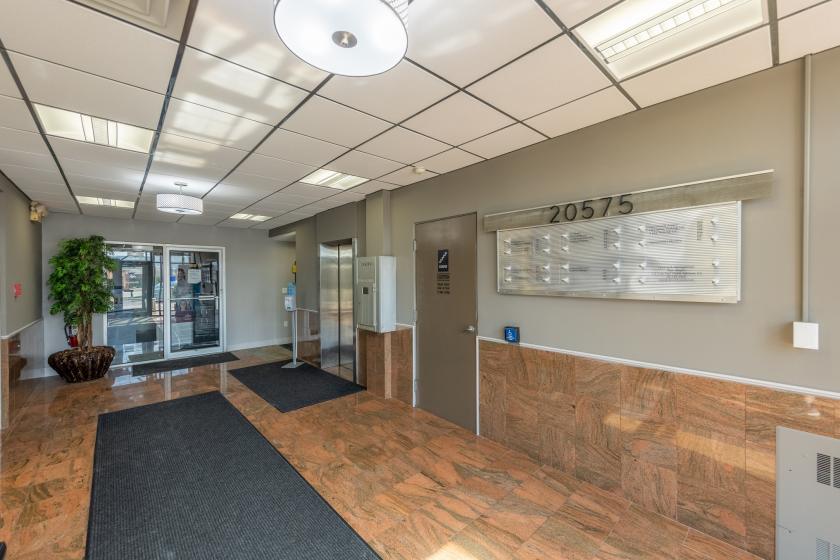
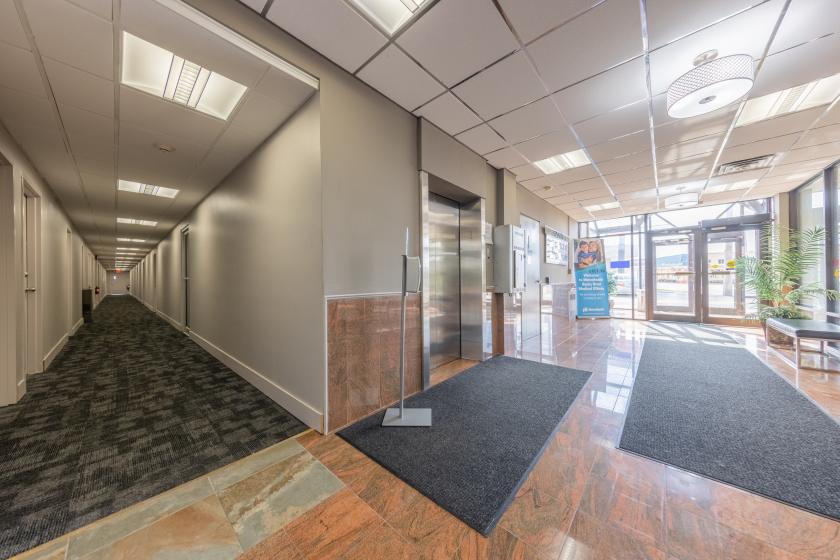
- • All new common area finishes
- • Center Ridge Road signage available
- • 247 electronic access control systems
- • Most suites ready for quick occupancy
Additional Photos

Listing Agents

Alex Jelepis
O: 216-455-0916
M: 216-832-4060
ajelepis@naipvc.com
O: 216-455-0916
M: 216-832-4060
ajelepis@naipvc.com
While we strive to provide the most accurate information, all listing information, and demographic data, is provided by third-parties. As such, MyEListing will not be responsible for the accuracy of the information. It is strongly recommended that you verify all information with the listing agent, and any relevant agencies, prior to making any decisions.