Retail Space
106 Caldwell Avenue Belen, NM 87002
106 Caldwell Avenue Belen, NM 87002
Details & Description
Property Highlights
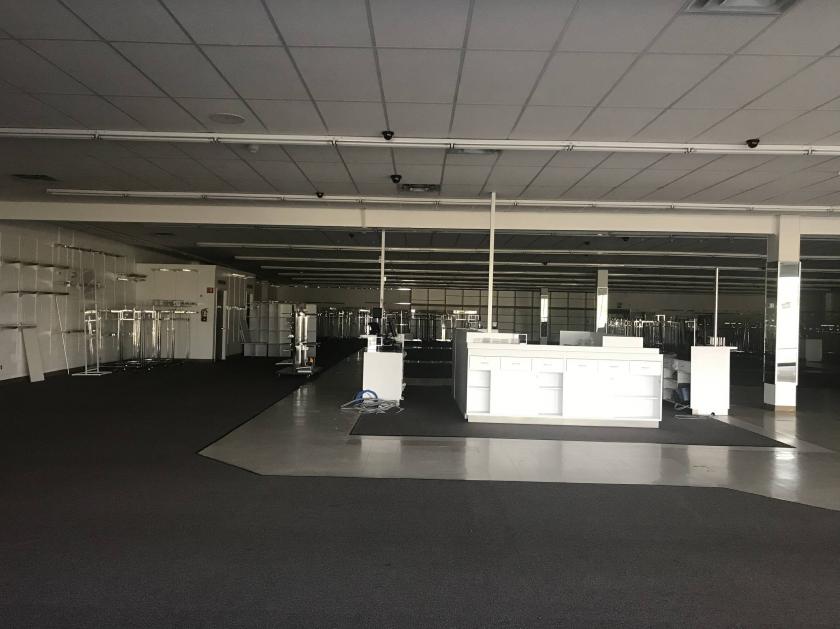
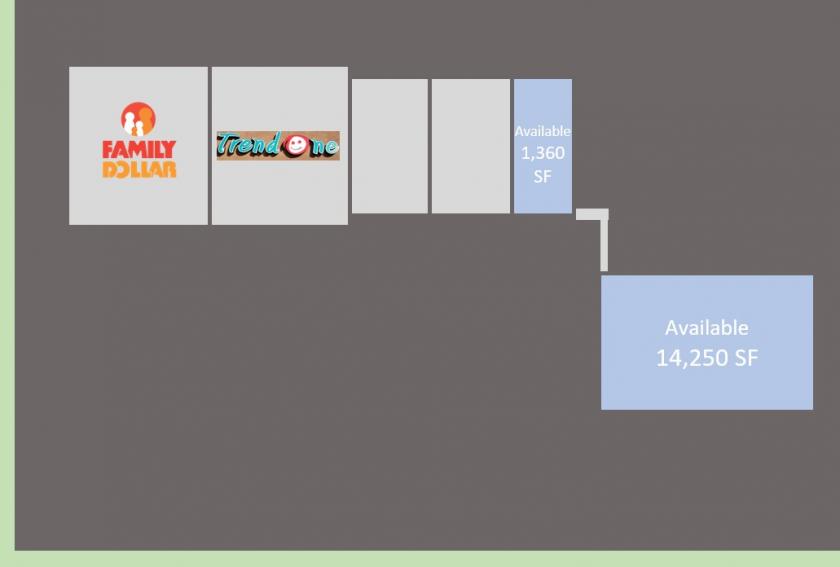
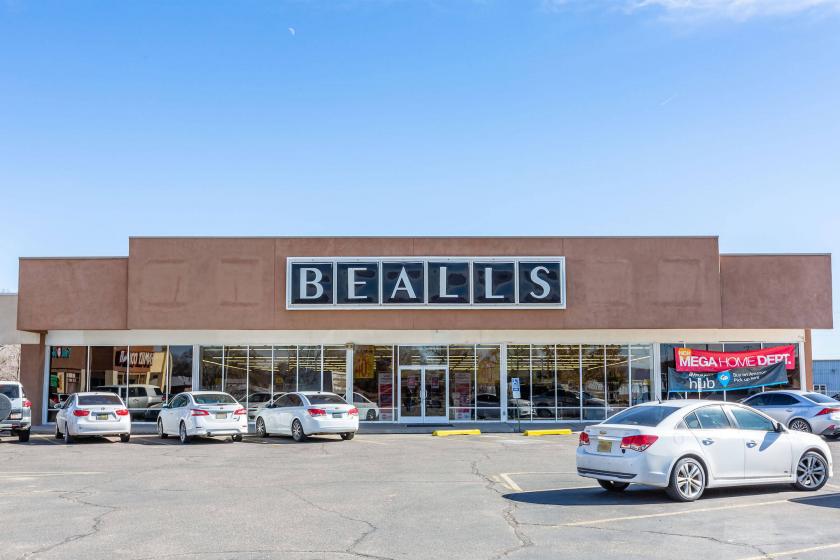
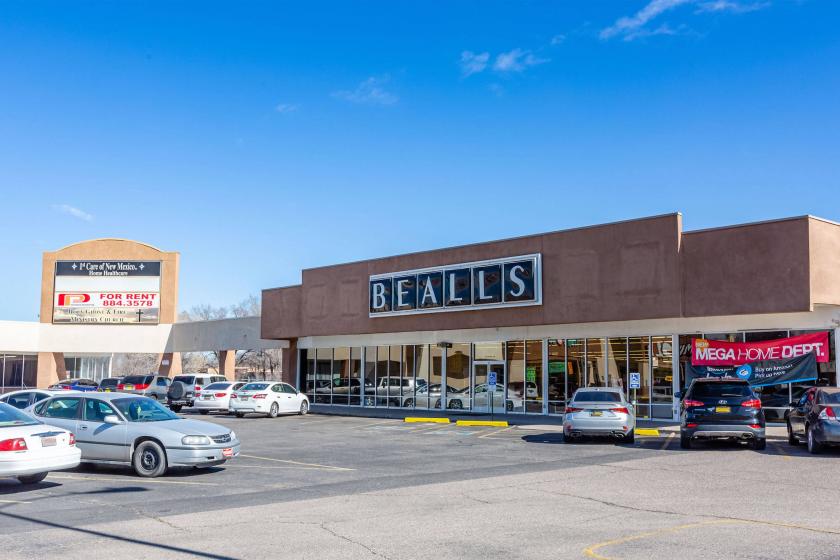
- • Former Bealls space
- • Directly south of Albuquerque
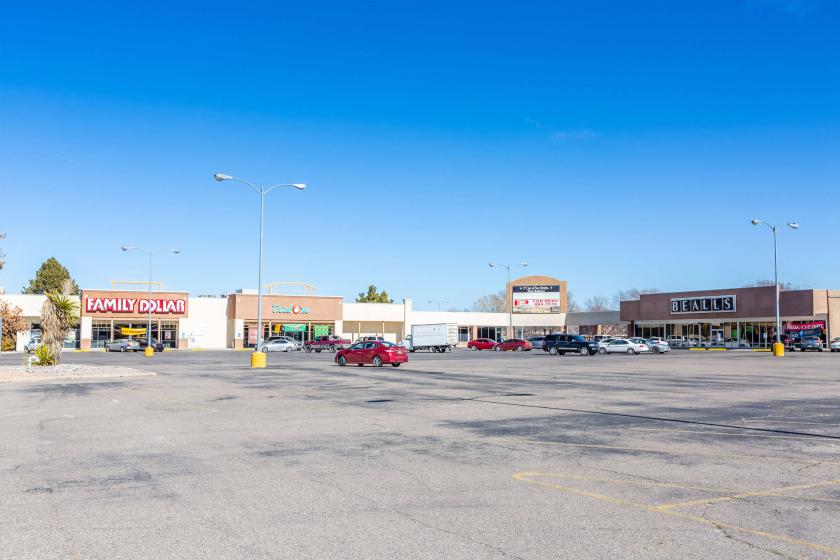
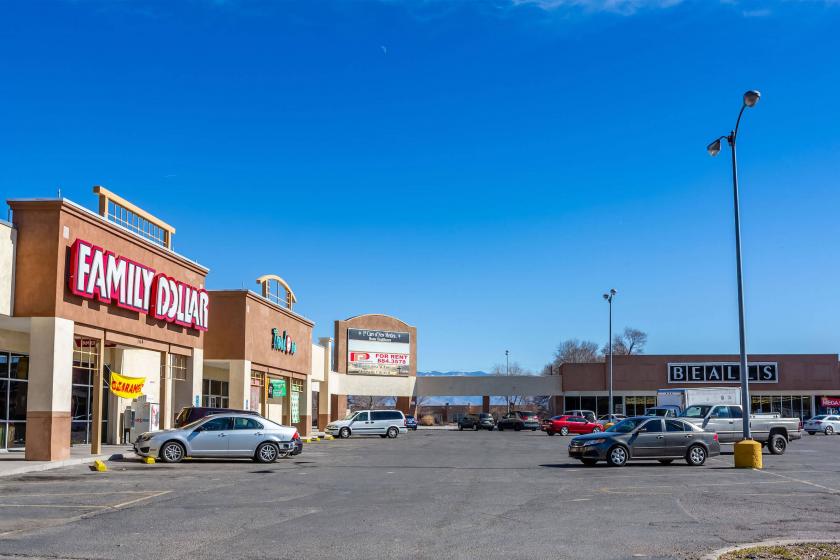
- • Located on a busy street
- • Exceptional visibility frontage
- • Ample parking
Additional Photos


Listing Agents

Jordan Gorjian
O: 516-261-2699
M: 516-858-0238
jordan@gorjianacq.com
O: 516-261-2699
M: 516-858-0238
jordan@gorjianacq.com
While we strive to provide the most accurate information, all listing information, and demographic data, is provided by third-parties. As such, MyEListing will not be responsible for the accuracy of the information. It is strongly recommended that you verify all information with the listing agent, and any relevant agencies, prior to making any decisions.