Retail Space
8665 West Flamingo Road Las Vegas, NV 89147
8665 West Flamingo Road Las Vegas, NV 89147
Details & Description
Property Highlights
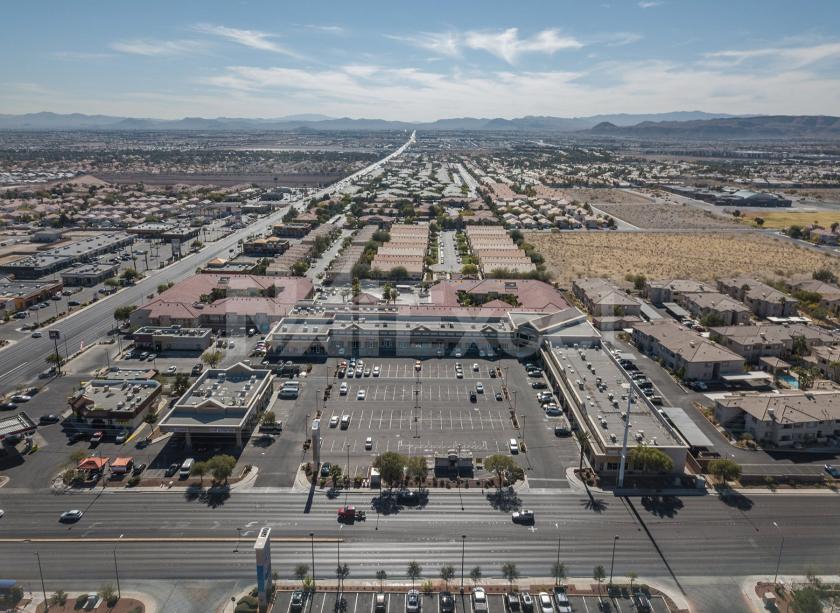
• Minutes from the CC 215 Beltway, 9 miles from McCarran International Airport and 6 miles from Las Vegas Strip
• Located on the Busy Southwest Corner of W Flamingo Rd and S Durango Dr
Listing Agents

Maria Herman
O: 702-383-3383
M: 702-334-7280
mherman@naiexcel.com
O: 702-383-3383
M: 702-334-7280
mherman@naiexcel.com
While we strive to provide the most accurate information, all listing information, and demographic data, is provided by third-parties. As such, MyEListing will not be responsible for the accuracy of the information. It is strongly recommended that you verify all information with the listing agent, and any relevant agencies, prior to making any decisions.