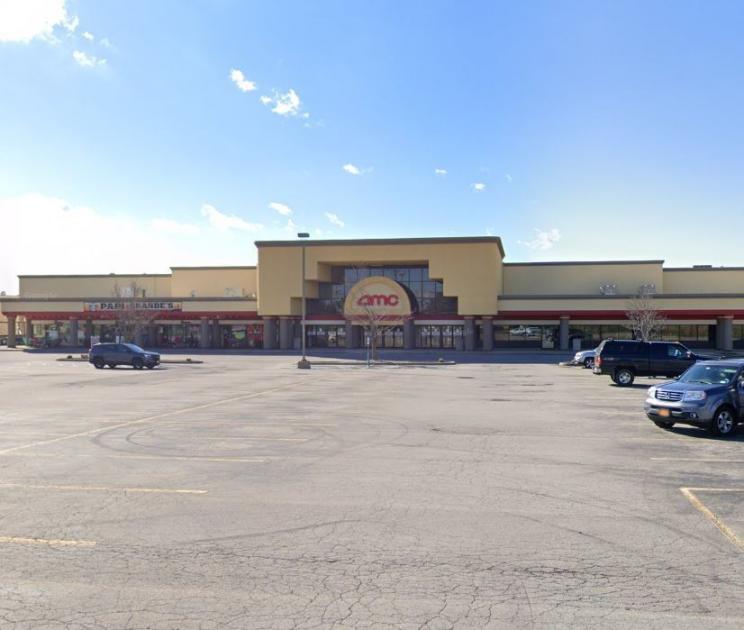
1-Mile | 3-Miles | 5-Miles | ||
---|---|---|---|---|
Total Population | 8,942 | 112,124 | 306,467 | |
Population Median Age | 37 | 40 | 40 | |
Population by Age | 0-9 Yrs | 618 (6%) | 10607 (9%) | 32179 (10%) |
10-19 Yrs | 1445 (16%) | 15654 (13%) | 38057 (12%) | |
20-29 Yrs | 2549 (28%) | 20490 (18%) | 49827 (16%) | |
30-39 Yrs | 990 (11%) | 13056 (11%) | 38804 (12%) | |
40-49 Yrs | 648 (7%) | 11140 (9%) | 33969 (11%) | |
50-59 Yrs | 960 (10%) | 13304 (11%) | 39412 (12%) | |
60-69 Yrs | 761 (8%) | 13100 (11%) | 36824 (12%) | |
70+ Yrs | 973 (10%) | 14773 (13%) | 37395 (12%) | |
Median HH Income | $50,385 | $65,814 | $58,606 | |
Total Household Income | < 24K | 927 (25%) | 8652 (18%) | 29207 (22%) |
25-49K | 875 (24%) | 8684 (19%) | 27508 (20%) | |
50-74K | 736 (20%) | 8471 (18%) | 23676 (17%) | |
75-99K | 446 (12%) | 6249 (13%) | 17547 (13%) | |
100-199K | 524 (14%) | 11361 (24%) | 27525 (20%) | |
200K+ | 123 (3%) | 2242 (4%) | 6127 (4%) | |
Highest Education Level | No Diploma | 277 | 3360 | 13911 |
Diploma or GED | 1141 | 14347 | 49574 | |
Some College | 873 | 12624 | 38588 | |
Assoc. Degree | 551 | 8618 | 23324 | |
Bachelors Degree | 1157 | 19127 | 47809 | |
Higher Degree | 1284 | 16088 | 38396 | |
Total Housing Units | 3,977 | 48,618 | 142,401 | |
--Owner-Occupied | 2,025 | 32,506 | 83,705 | |
--Renter-Occupied | 1,606 | 13,152 | 47,885 | |
Owner-Occupied Values | < 100K | 510 | 4164 | 18652 |
100-199K | 1356 | 19780 | 42489 | |
200-299K | 121 | 6201 | 14354 | |
300-399K | 15 | 1510 | 4846 | |
400-499K | 4 | 261 | 1261 | |
500K+ | 20 | 591 | 2103 | |
Total Working Age Population | 8,032 | 94,818 | 254,105 | |
In Work Force | 4,383 | 56,777 | 158,291 | |
Not In Work Force | 3,648 | 38,041 | 95,814 | |
Workforce Employed | 4,260 | 54,928 | 151,528 | |
Workforce Unemployed | 120 | 1,693 | 6,491 | |
Civlian Workforce | 4,380 | 56,622 | 158,019 | |
Military Workforce | 3 | 156 | 272 | |
Total Households | 3,631 | 45,658 | 131,590 | |
Family Households | 1,637 | 26,396 | 74,436 | |
Non-Family Households | 1,994 | 19,262 | 57,154 | |
Married Couple | 1,137 | 19,813 | 51,288 | |
Other Family | 501 | 6,583 | 23,148 | |
Married w/Child | 305 | 7,185 | 18,560 | |
Single Male w/Child | 49 | 847 | 2,258 | |
Single Female w/Child | 124 | 2,233 | 9,709 |
Population Change Last Two Decades - Plus Projection
2000 | % | 2010 | % | 2020 | % | 2030 | |
---|---|---|---|---|---|---|---|
New York | 18,976,457 | +2 | 19,378,102 | +4 | 20,146,131 | +2 | 20,604,030 |
Erie County | 950,265 | -3 | 919,040 | +2 | 936,084 | +1 | 949,073 |
Niagara County | 219,846 | -2 | 216,469 | -3 | 209,940 | -3 | 202,950 |
Total Working Age Population:
Total Households:
Total Working Age Population:
Total Households:
Total Working Age Population:
Total Households: