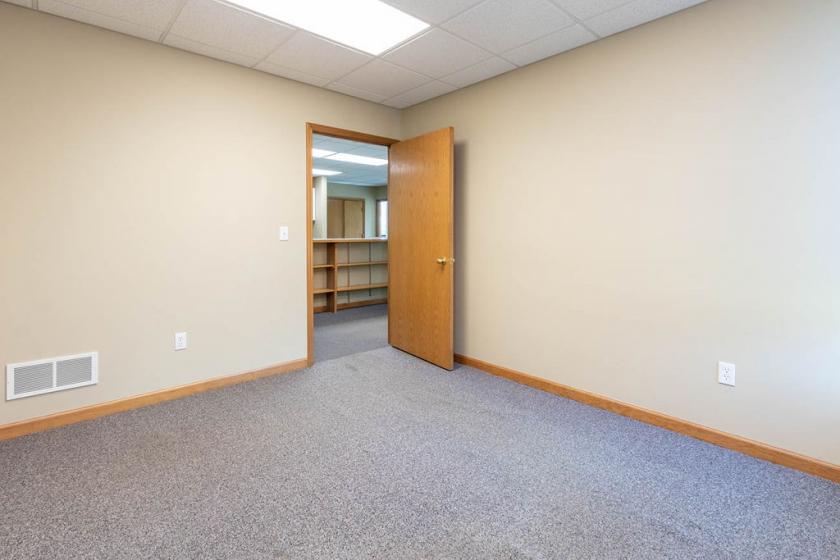
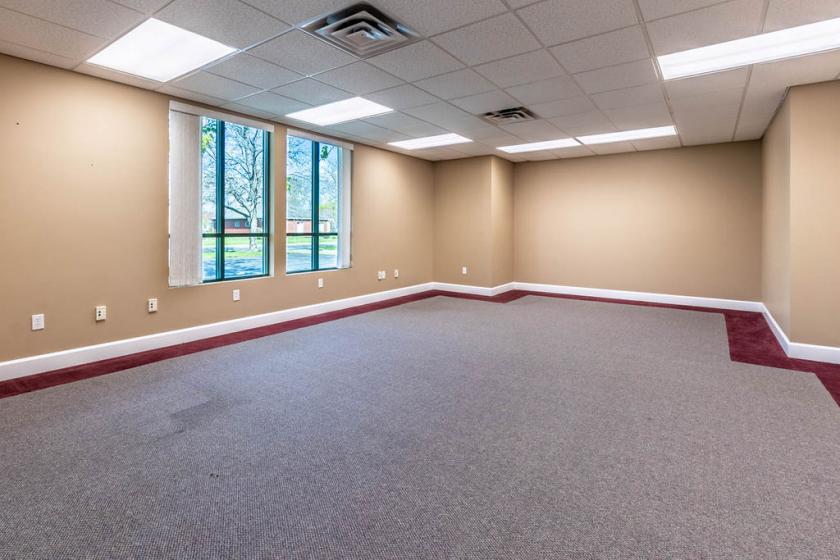
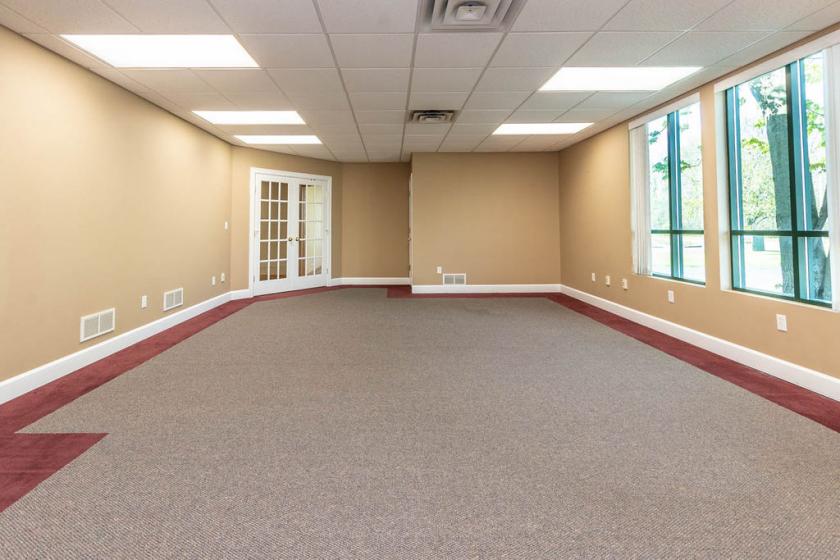
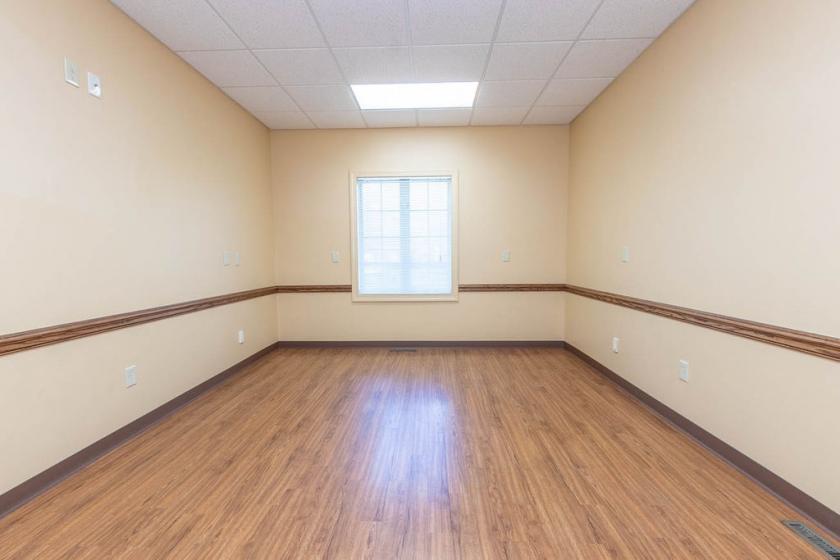
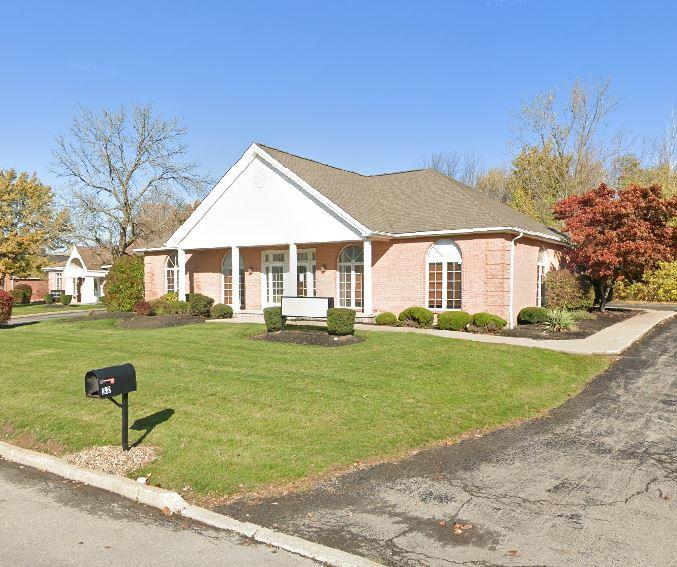
1-Mile | 3-Miles | 5-Miles | ||
---|---|---|---|---|
Total Population | 4,990 | 31,400 | 43,308 | |
Population Median Age | 45 | 41 | 40 | |
Population by Age | 0-9 Yrs | 496 (9%) | 3885 (12%) | 5319 (12%) |
10-19 Yrs | 400 (8%) | 3240 (10%) | 4680 (10%) | |
20-29 Yrs | 622 (12%) | 3992 (12%) | 5615 (12%) | |
30-39 Yrs | 579 (11%) | 4244 (13%) | 5627 (12%) | |
40-49 Yrs | 534 (10%) | 3633 (11%) | 5296 (12%) | |
50-59 Yrs | 677 (13%) | 4500 (14%) | 6182 (14%) | |
60-69 Yrs | 824 (16%) | 4415 (14%) | 5912 (13%) | |
70+ Yrs | 858 (17%) | 3492 (11%) | 4678 (10%) | |
Median HH Income | $61,237 | $49,842 | $55,313 | |
Total Household Income | < 24K | 396 (17%) | 3107 (22%) | 3822 (21%) |
25-49K | 528 (23%) | 3707 (27%) | 4531 (25%) | |
50-74K | 388 (17%) | 2246 (16%) | 2861 (15%) | |
75-99K | 295 (13%) | 1726 (12%) | 2320 (12%) | |
100-199K | 538 (24%) | 2563 (18%) | 3969 (22%) | |
200K+ | 67 (3%) | 236 (1%) | 470 (2%) | |
Highest Education Level | No Diploma | 213 | 2311 | 2933 |
Diploma or GED | 974 | 6923 | 9473 | |
Some College | 657 | 4578 | 6206 | |
Assoc. Degree | 750 | 3443 | 4468 | |
Bachelors Degree | 704 | 3226 | 4573 | |
Higher Degree | 522 | 2315 | 3334 | |
Total Housing Units | 2,472 | 15,732 | 20,548 | |
--Owner-Occupied | 1,557 | 8,660 | 12,180 | |
--Renter-Occupied | 656 | 4,926 | 5,792 | |
Owner-Occupied Values | < 100K | 351 | 4101 | 5078 |
100-199K | 1007 | 3342 | 4622 | |
200-299K | 143 | 763 | 1673 | |
300-399K | 35 | 246 | 445 | |
400-499K | 0 | 33 | 145 | |
500K+ | 21 | 175 | 216 | |
Total Working Age Population | 4,205 | 25,465 | 35,124 | |
In Work Force | 2,541 | 15,808 | 21,852 | |
Not In Work Force | 1,664 | 9,657 | 13,272 | |
Workforce Employed | 2,470 | 14,929 | 20,564 | |
Workforce Unemployed | 70 | 874 | 1,234 | |
Civlian Workforce | 2,541 | 15,803 | 21,798 | |
Military Workforce | 0 | 5 | 54 | |
Total Households | 2,212 | 13,586 | 17,972 | |
Family Households | 1,319 | 7,687 | 10,830 | |
Non-Family Households | 893 | 5,898 | 7,143 | |
Married Couple | 993 | 5,365 | 7,786 | |
Other Family | 326 | 2,322 | 3,044 | |
Married w/Child | 268 | 1,918 | 2,824 | |
Single Male w/Child | 48 | 421 | 540 | |
Single Female w/Child | 104 | 898 | 1,177 |
Population Change Last Two Decades - Plus Projection
2000 | % | 2010 | % | 2020 | % | 2030 | |
---|---|---|---|---|---|---|---|
New York | 18,976,457 | +2 | 19,378,102 | +4 | 20,146,131 | +2 | 20,604,030 |
Erie County | 950,265 | -3 | 919,040 | +2 | 936,084 | +1 | 949,073 |
Niagara County | 219,846 | -2 | 216,469 | -3 | 209,940 | -3 | 202,950 |
Total Working Age Population:
Total Households:
Total Working Age Population:
Total Households:
Total Working Age Population:
Total Households: