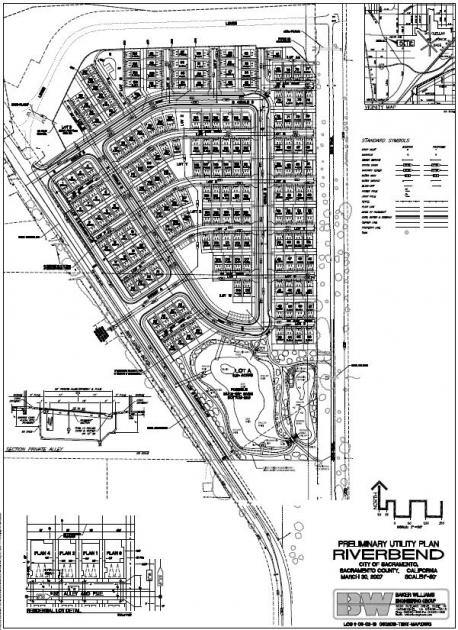
1-Mile | 3-Miles | 5-Miles | ||
---|---|---|---|---|
Total Population | 5,676 | 74,616 | 265,594 | |
Population Median Age | 36 | 34 | 35 | |
Population by Age | 0-9 Yrs | 878 (15%) | 11146 (14%) | 40169 (15%) |
10-19 Yrs | 660 (11%) | 11626 (15%) | 37385 (14%) | |
20-29 Yrs | 810 (14%) | 11285 (15%) | 41159 (15%) | |
30-39 Yrs | 974 (17%) | 11112 (14%) | 40832 (15%) | |
40-49 Yrs | 729 (12%) | 9194 (12%) | 32577 (12%) | |
50-59 Yrs | 726 (12%) | 9413 (12%) | 30595 (11%) | |
60-69 Yrs | 529 (9%) | 6520 (8%) | 25166 (9%) | |
70+ Yrs | 369 (6%) | 4320 (5%) | 17710 (6%) | |
Median HH Income | $68,548 | $57,429 | $54,143 | |
Total Household Income | < 24K | 214 (12%) | 4530 (20%) | 19865 (22%) |
25-49K | 414 (23%) | 5344 (24%) | 21881 (24%) | |
50-74K | 335 (19%) | 4101 (18%) | 15627 (17%) | |
75-99K | 354 (20%) | 3076 (13%) | 10810 (12%) | |
100-199K | 323 (18%) | 4293 (19%) | 17711 (19%) | |
200K+ | 89 (5%) | 845 (3%) | 3494 (3%) | |
Highest Education Level | No Diploma | 624 | 9574 | 27646 |
Diploma or GED | 1326 | 14825 | 49360 | |
Some College | 860 | 10650 | 40058 | |
Assoc. Degree | 272 | 4047 | 15377 | |
Bachelors Degree | 548 | 5731 | 26133 | |
Higher Degree | 97 | 1834 | 11736 | |
Total Housing Units | 1,829 | 23,638 | 94,410 | |
--Owner-Occupied | 1,161 | 12,345 | 41,875 | |
--Renter-Occupied | 569 | 9,845 | 47,514 | |
Owner-Occupied Values | < 100K | 36 | 738 | 2591 |
100-199K | 156 | 2459 | 7100 | |
200-299K | 610 | 4715 | 14700 | |
300-399K | 224 | 2431 | 9409 | |
400-499K | 62 | 1218 | 4990 | |
500K+ | 74 | 783 | 3085 | |
Total Working Age Population | 4,355 | 55,862 | 201,372 | |
In Work Force | 2,873 | 34,286 | 126,463 | |
Not In Work Force | 1,482 | 21,576 | 74,909 | |
Workforce Employed | 2,746 | 31,990 | 117,800 | |
Workforce Unemployed | 127 | 2,236 | 8,445 | |
Civlian Workforce | 2,873 | 34,226 | 126,245 | |
Military Workforce | 0 | 60 | 218 | |
Total Households | 1,730 | 22,189 | 89,389 | |
Family Households | 1,246 | 16,536 | 60,395 | |
Non-Family Households | 484 | 5,653 | 28,993 | |
Married Couple | 857 | 10,382 | 37,897 | |
Other Family | 389 | 6,155 | 22,498 | |
Married w/Child | 389 | 5,210 | 18,761 | |
Single Male w/Child | 42 | 908 | 3,285 | |
Single Female w/Child | 131 | 2,102 | 8,364 |
Population Change Last Two Decades - Plus Projection
2000 | % | 2010 | % | 2020 | % | 2030 | |
---|---|---|---|---|---|---|---|
California | 33,871,648 | +10 | 37,253,956 | +9 | 40,467,295 | +8 | 43,631,295 |
Placer County | 248,399 | +40 | 348,432 | +15 | 399,388 | +14 | 456,175 |
Sacramento County | 1,223,499 | +16 | 1,418,788 | +11 | 1,572,195 | +12 | 1,758,565 |
Sutter County | 78,930 | +20 | 94,737 | +6 | 100,345 | +9 | 109,678 |
Yolo County | 168,660 | +19 | 200,849 | +13 | 227,595 | +14 | 259,339 |
Total Working Age Population:
Total Households:
Total Working Age Population:
Total Households:
Total Working Age Population:
Total Households: