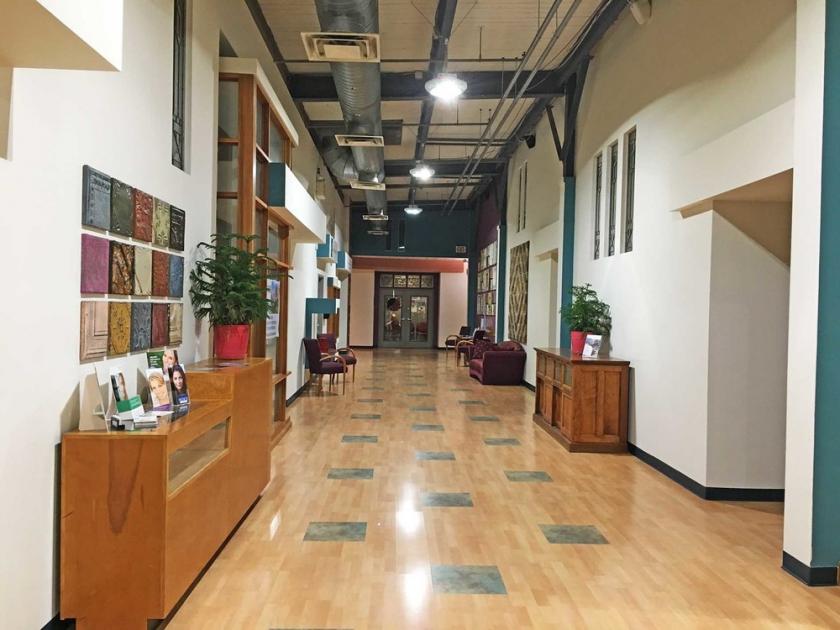
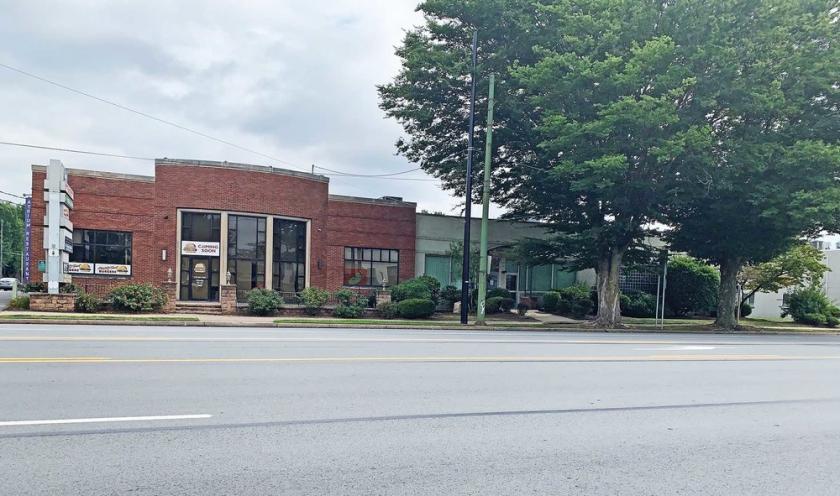
1-Mile | 3-Miles | 5-Miles | ||
---|---|---|---|---|
Total Population | 16,635 | 90,921 | 123,902 | |
Population Median Age | 39 | 40 | 41 | |
Population by Age | 0-9 Yrs | 1637 (9%) | 9914 (10%) | 13456 (10%) |
10-19 Yrs | 2713 (16%) | 11510 (12%) | 14681 (11%) | |
20-29 Yrs | 3120 (18%) | 13726 (15%) | 17612 (14%) | |
30-39 Yrs | 1872 (11%) | 11401 (12%) | 15439 (12%) | |
40-49 Yrs | 1399 (8%) | 9463 (10%) | 13524 (10%) | |
50-59 Yrs | 1762 (10%) | 11796 (12%) | 16647 (13%) | |
60-69 Yrs | 1727 (10%) | 11027 (12%) | 15647 (12%) | |
70+ Yrs | 2405 (14%) | 12084 (13%) | 16896 (13%) | |
Median HH Income | $43,915 | $44,416 | $47,558 | |
Total Household Income | < 24K | 1821 (28%) | 11301 (29%) | 14421 (27%) |
25-49K | 1599 (25%) | 9507 (24%) | 12706 (24%) | |
50-74K | 1078 (17%) | 7019 (18%) | 9699 (18%) | |
75-99K | 697 (11%) | 4450 (11%) | 6259 (12%) | |
100-199K | 923 (14%) | 5083 (13%) | 7802 (14%) | |
200K+ | 192 (3%) | 681 (1%) | 1186 (2%) | |
Highest Education Level | No Diploma | 801 | 6517 | 8342 |
Diploma or GED | 3561 | 25118 | 34336 | |
Some College | 1746 | 11684 | 16042 | |
Assoc. Degree | 979 | 5923 | 8605 | |
Bachelors Degree | 1922 | 8567 | 12635 | |
Higher Degree | 1351 | 4906 | 7225 | |
Total Housing Units | 7,596 | 45,704 | 61,333 | |
--Owner-Occupied | 2,708 | 20,823 | 30,662 | |
--Renter-Occupied | 3,601 | 17,218 | 21,411 | |
Owner-Occupied Values | < 100K | 764 | 11332 | 15128 |
100-199K | 1389 | 7444 | 11539 | |
200-299K | 402 | 1504 | 2694 | |
300-399K | 100 | 402 | 861 | |
400-499K | 9 | 57 | 170 | |
500K+ | 45 | 83 | 270 | |
Total Working Age Population | 14,024 | 74,546 | 102,066 | |
In Work Force | 7,354 | 44,624 | 62,006 | |
Not In Work Force | 6,670 | 29,922 | 40,060 | |
Workforce Employed | 6,934 | 41,279 | 57,794 | |
Workforce Unemployed | 419 | 3,289 | 4,132 | |
Civlian Workforce | 7,353 | 44,568 | 61,927 | |
Military Workforce | 1 | 56 | 79 | |
Total Households | 6,309 | 38,041 | 52,073 | |
Family Households | 3,197 | 21,617 | 30,424 | |
Non-Family Households | 3,112 | 16,424 | 21,649 | |
Married Couple | 1,950 | 13,252 | 19,762 | |
Other Family | 1,247 | 8,365 | 10,662 | |
Married w/Child | 652 | 4,165 | 6,281 | |
Single Male w/Child | 192 | 1,152 | 1,369 | |
Single Female w/Child | 607 | 3,523 | 4,541 |
Population Change Last Two Decades - Plus Projection
2000 | % | 2010 | % | 2020 | % | 2030 | |
---|---|---|---|---|---|---|---|
Pennsylvania | 12,281,054 | +3 | 12,702,379 | +4 | 13,230,170 | +4 | 13,759,594 |
Lackawanna County | 213,295 | +1 | 214,437 | +3 | 221,688 | +3 | 229,062 |
Luzerne County | 319,250 | +1 | 320,918 | +2 | 327,889 | +2 | 334,201 |
Total Working Age Population:
Total Households:
Total Working Age Population:
Total Households:
Total Working Age Population:
Total Households: