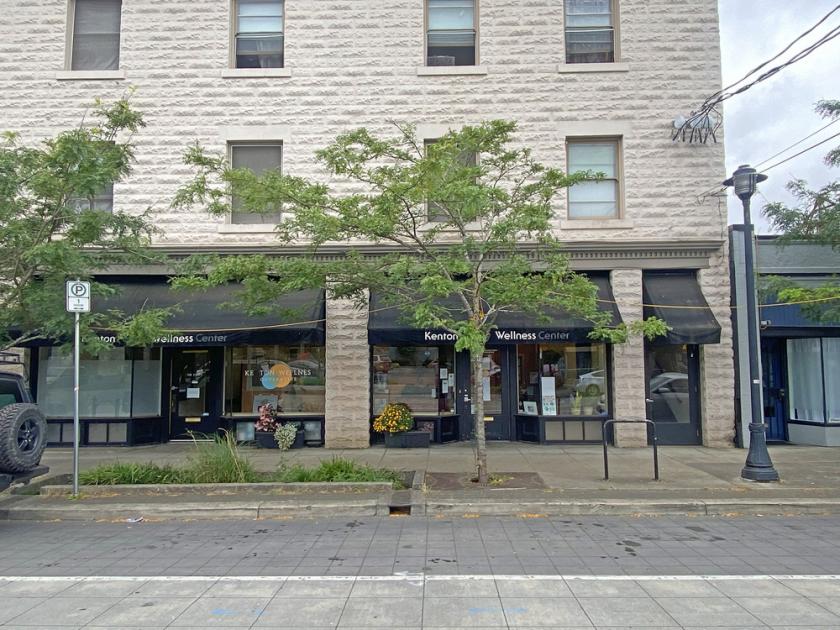
1-Mile | 3-Miles | 5-Miles | ||
---|---|---|---|---|
Total Population | 15,043 | 105,111 | 283,377 | |
Population Median Age | 38 | 37 | 39 | |
Population by Age | 0-9 Yrs | 1448 (9%) | 10543 (10%) | 25812 (9%) |
10-19 Yrs | 1174 (7%) | 10317 (9%) | 24141 (8%) | |
20-29 Yrs | 2120 (14%) | 18117 (17%) | 49115 (17%) | |
30-39 Yrs | 3635 (24%) | 22559 (21%) | 58433 (20%) | |
40-49 Yrs | 2768 (18%) | 16407 (15%) | 41355 (14%) | |
50-59 Yrs | 1506 (10%) | 11019 (10%) | 32995 (11%) | |
60-69 Yrs | 1518 (10%) | 9471 (9%) | 30470 (10%) | |
70+ Yrs | 874 (5%) | 6677 (6%) | 21057 (7%) | |
Median HH Income | $82,583 | $77,302 | $68,587 | |
Total Household Income | < 24K | 716 (11%) | 6686 (15%) | 26028 (20%) |
25-49K | 804 (13%) | 6647 (15%) | 23054 (17%) | |
50-74K | 1241 (20%) | 7077 (16%) | 20295 (15%) | |
75-99K | 1050 (17%) | 5698 (13%) | 14793 (11%) | |
100-199K | 1820 (29%) | 11889 (28%) | 31909 (24%) | |
200K+ | 528 (8%) | 3872 (9%) | 12808 (9%) | |
Highest Education Level | No Diploma | 743 | 4701 | 12602 |
Diploma or GED | 1682 | 10956 | 30197 | |
Some College | 2484 | 15914 | 42548 | |
Assoc. Degree | 775 | 4867 | 13890 | |
Bachelors Degree | 3961 | 25166 | 70253 | |
Higher Degree | 2166 | 15525 | 46296 | |
Total Housing Units | 6,435 | 44,737 | 139,474 | |
--Owner-Occupied | 4,250 | 24,426 | 59,609 | |
--Renter-Occupied | 1,908 | 17,442 | 69,277 | |
Owner-Occupied Values | < 100K | 50 | 710 | 1679 |
100-199K | 144 | 1269 | 3711 | |
200-299K | 616 | 3116 | 8257 | |
300-399K | 1535 | 6191 | 12193 | |
400-499K | 1177 | 6041 | 11036 | |
500K+ | 727 | 7099 | 22732 | |
Total Working Age Population | 12,757 | 89,026 | 243,894 | |
In Work Force | 9,839 | 65,791 | 172,450 | |
Not In Work Force | 2,918 | 23,235 | 71,444 | |
Workforce Employed | 9,548 | 62,713 | 164,578 | |
Workforce Unemployed | 291 | 3,075 | 7,751 | |
Civlian Workforce | 9,839 | 65,788 | 172,329 | |
Military Workforce | 0 | 3 | 121 | |
Total Households | 6,158 | 41,868 | 128,886 | |
Family Households | 3,316 | 21,104 | 55,974 | |
Non-Family Households | 2,843 | 20,764 | 72,912 | |
Married Couple | 2,435 | 15,136 | 42,013 | |
Other Family | 880 | 5,968 | 13,961 | |
Married w/Child | 930 | 6,138 | 15,941 | |
Single Male w/Child | 138 | 809 | 2,166 | |
Single Female w/Child | 318 | 2,184 | 5,085 |
Population Change Last Two Decades - Plus Projection
2000 | % | 2010 | % | 2020 | % | 2030 | |
---|---|---|---|---|---|---|---|
Oregon | 3,421,399 | +12 | 3,831,074 | +11 | 4,264,810 | +11 | 4,727,438 |
Multnomah County | 660,486 | +11 | 735,334 | +12 | 822,675 | +10 | 906,904 |
Washington County | 445,342 | +19 | 529,710 | +17 | 619,337 | +16 | 718,633 |
Washington | 5,894,121 | +14 | 6,724,540 | +14 | 7,638,415 | +11 | 8,503,178 |
Clark County | 345,238 | +23 | 425,363 | +17 | 499,400 | +16 | 576,879 |
Total Working Age Population:
Total Households:
Total Working Age Population:
Total Households:
Total Working Age Population:
Total Households: