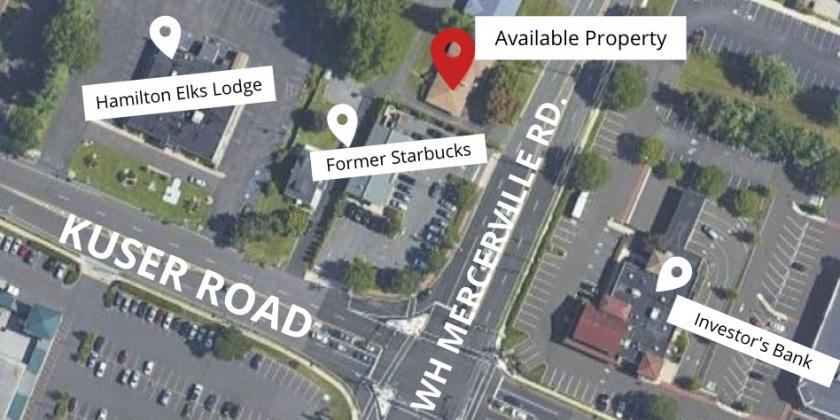
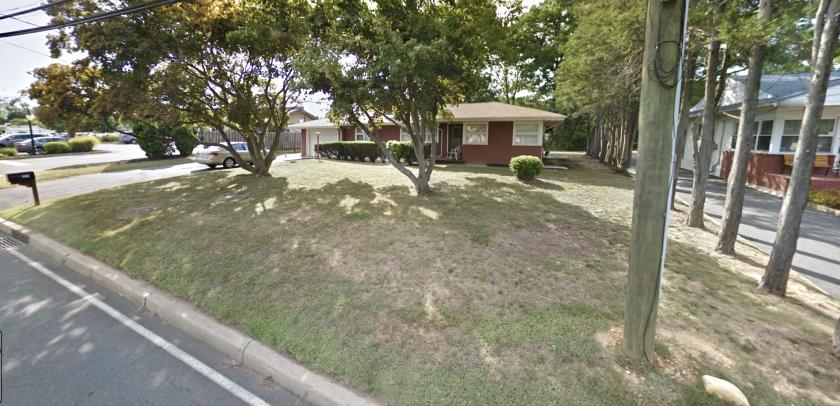
1-Mile | 3-Miles | 5-Miles | ||
---|---|---|---|---|
Total Population | 10,226 | 111,857 | 216,994 | |
Population Median Age | 45 | 38 | 38 | |
Population by Age | 0-9 Yrs | 729 (7%) | 13808 (12%) | 26686 (12%) |
10-19 Yrs | 1011 (9%) | 13079 (11%) | 26080 (12%) | |
20-29 Yrs | 1303 (12%) | 16855 (15%) | 31582 (14%) | |
30-39 Yrs | 1519 (14%) | 16299 (14%) | 30596 (14%) | |
40-49 Yrs | 971 (9%) | 14434 (12%) | 28524 (13%) | |
50-59 Yrs | 1465 (14%) | 14531 (12%) | 29703 (13%) | |
60-69 Yrs | 1583 (15%) | 12443 (11%) | 23879 (11%) | |
70+ Yrs | 1646 (16%) | 10408 (9%) | 19943 (9%) | |
Median HH Income | $63,919 | $68,565 | $65,724 | |
Total Household Income | < 24K | 1003 (20%) | 6182 (15%) | 16424 (20%) |
25-49K | 971 (20%) | 8332 (21%) | 14714 (18%) | |
50-74K | 860 (17%) | 6910 (17%) | 12876 (16%) | |
75-99K | 776 (16%) | 6076 (15%) | 10290 (13%) | |
100-199K | 1053 (21%) | 9659 (24%) | 18433 (23%) | |
200K+ | 167 (3%) | 2097 (5%) | 5770 (7%) | |
Highest Education Level | No Diploma | 631 | 12155 | 22799 |
Diploma or GED | 2841 | 25682 | 46869 | |
Some College | 1584 | 15822 | 29137 | |
Assoc. Degree | 591 | 5214 | 9289 | |
Bachelors Degree | 1590 | 12296 | 25477 | |
Higher Degree | 632 | 5434 | 15097 | |
Total Housing Units | 5,146 | 43,100 | 88,820 | |
--Owner-Occupied | 2,760 | 24,587 | 46,346 | |
--Renter-Occupied | 2,070 | 14,669 | 32,160 | |
Owner-Occupied Values | < 100K | 94 | 3573 | 6816 |
100-199K | 909 | 6837 | 12304 | |
200-299K | 1131 | 9019 | 14273 | |
300-399K | 492 | 3928 | 7788 | |
400-499K | 88 | 892 | 2862 | |
500K+ | 45 | 337 | 2303 | |
Total Working Age Population | 8,869 | 90,312 | 174,842 | |
In Work Force | 5,738 | 60,930 | 113,736 | |
Not In Work Force | 3,131 | 29,382 | 61,107 | |
Workforce Employed | 5,495 | 57,021 | 105,478 | |
Workforce Unemployed | 243 | 3,821 | 8,086 | |
Civlian Workforce | 5,738 | 60,842 | 113,564 | |
Military Workforce | 0 | 88 | 172 | |
Total Households | 4,830 | 39,256 | 78,506 | |
Family Households | 2,423 | 26,361 | 50,436 | |
Non-Family Households | 2,407 | 12,895 | 28,070 | |
Married Couple | 1,620 | 17,651 | 32,948 | |
Other Family | 803 | 8,710 | 17,489 | |
Married w/Child | 473 | 6,877 | 13,152 | |
Single Male w/Child | 42 | 808 | 1,509 | |
Single Female w/Child | 186 | 3,152 | 6,692 |
Population Change Last Two Decades - Plus Projection
2000 | % | 2010 | % | 2020 | % | 2030 | |
---|---|---|---|---|---|---|---|
New Jersey | 8,414,350 | +4 | 8,791,894 | +4 | 9,132,700 | +4 | 9,530,900 |
Burlington County | 423,394 | +6 | 448,734 | 0 | 450,000 | +3 | 464,900 |
Mercer County | 350,761 | +4 | 366,513 | +3 | 379,000 | +5 | 397,400 |
Middlesex County | 750,162 | +8 | 809,858 | +8 | 873,400 | +7 | 932,200 |
Monmouth County | 615,301 | +2 | 630,380 | 0 | 633,400 | +3 | 655,300 |
Pennsylvania | 12,281,054 | +3 | 12,702,379 | +4 | 13,230,170 | +4 | 13,759,594 |
Bucks County | 597,635 | +5 | 625,249 | +1 | 629,420 | +1 | 637,730 |
Total Working Age Population:
Total Households:
Total Working Age Population:
Total Households:
Total Working Age Population:
Total Households: