Office Space
9084 Technology Drive Fishers, IN 46038
9084 Technology Drive Fishers, IN 46038

Details & Description
Property Highlights
• Walking distance to Downtown Fishers, Launch Fishers, Nickel Plate Trail and dozens of restaurants
• Dynamic mix of creative office space, private offices, huddle rooms and conference space
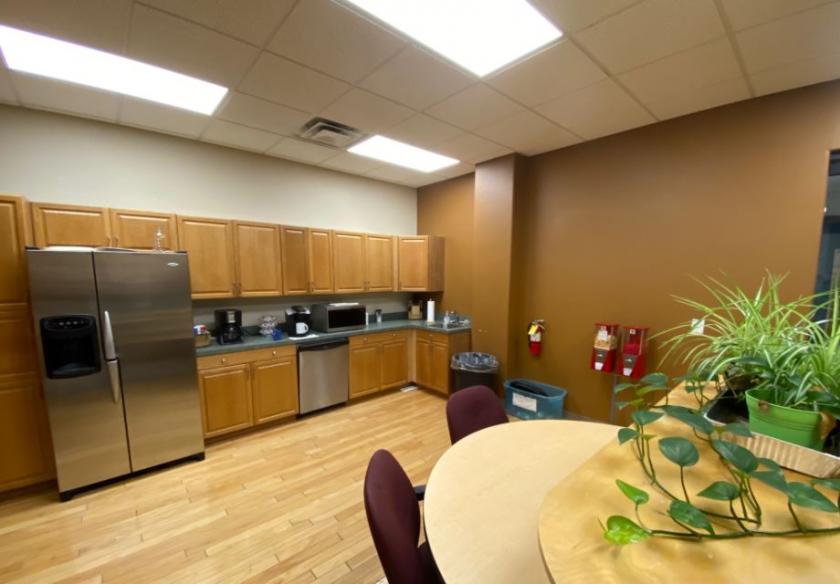
Additional Photos


Listing Agents

Brian Bondus
ALO Property Group
O: 317-853-7503
brian@alopg.com
ALO Property Group
O: 317-853-7503
brian@alopg.com
While we strive to provide the most accurate information, all listing information, and demographic data, is provided by third-parties. As such, MyEListing will not be responsible for the accuracy of the information. It is strongly recommended that you verify all information with the listing agent, and any relevant agencies, prior to making any decisions.


