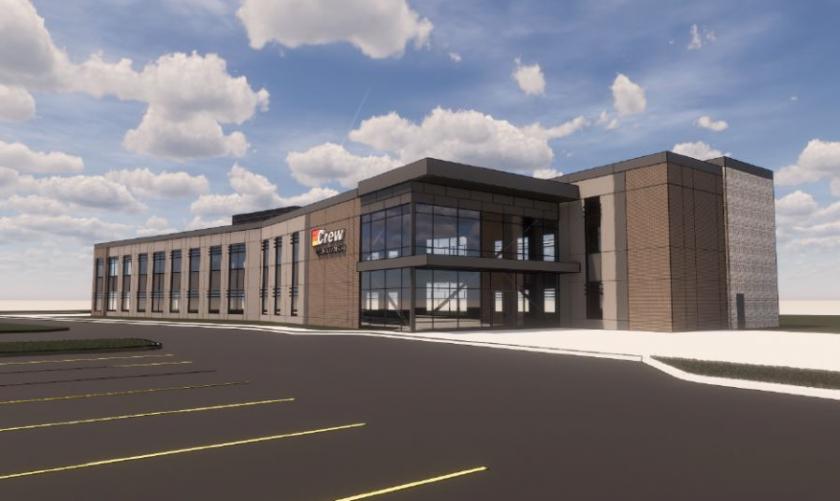
1-Mile | 3-Miles | 5-Miles | ||
---|---|---|---|---|
Total Population | 7,538 | 68,745 | 158,320 | |
Population Median Age | 34 | 35 | 37 | |
Population by Age | 0-9 Yrs | 1107 (14%) | 9416 (13%) | 21473 (13%) |
10-19 Yrs | 1116 (14%) | 10506 (15%) | 23279 (14%) | |
20-29 Yrs | 966 (12%) | 8821 (12%) | 18657 (11%) | |
30-39 Yrs | 1508 (20%) | 9985 (14%) | 23007 (14%) | |
40-49 Yrs | 1151 (15%) | 10682 (15%) | 23767 (15%) | |
50-59 Yrs | 855 (11%) | 9961 (14%) | 21866 (13%) | |
60-69 Yrs | 489 (6%) | 5322 (7%) | 15113 (9%) | |
70+ Yrs | 346 (4%) | 4053 (5%) | 11158 (7%) | |
Median HH Income | $92,865 | $100,434 | $100,202 | |
Total Household Income | < 24K | 150 (5%) | 1460 (5%) | 4085 (6%) |
25-49K | 365 (13%) | 3393 (13%) | 8531 (14%) | |
50-74K | 444 (15%) | 3986 (15%) | 9030 (15%) | |
75-99K | 621 (22%) | 4110 (15%) | 8305 (13%) | |
100-199K | 947 (33%) | 9467 (36%) | 20657 (34%) | |
200K+ | 279 (9%) | 3599 (13%) | 9411 (15%) | |
Highest Education Level | No Diploma | 142 | 837 | 2504 |
Diploma or GED | 533 | 5107 | 12699 | |
Some College | 722 | 7051 | 15815 | |
Assoc. Degree | 409 | 3068 | 7080 | |
Bachelors Degree | 1831 | 18564 | 42674 | |
Higher Degree | 1239 | 10043 | 24401 | |
Total Housing Units | 2,894 | 26,929 | 62,310 | |
--Owner-Occupied | 1,617 | 18,642 | 45,615 | |
--Renter-Occupied | 1,189 | 7,373 | 14,404 | |
Owner-Occupied Values | < 100K | 36 | 304 | 1129 |
100-199K | 603 | 5736 | 13472 | |
200-299K | 516 | 6656 | 13489 | |
300-399K | 344 | 3289 | 9033 | |
400-499K | 68 | 1298 | 4250 | |
500K+ | 50 | 1360 | 4243 | |
Total Working Age Population | 5,647 | 52,097 | 120,904 | |
In Work Force | 4,231 | 39,832 | 90,095 | |
Not In Work Force | 1,416 | 12,264 | 30,809 | |
Workforce Employed | 4,127 | 38,523 | 87,301 | |
Workforce Unemployed | 95 | 1,228 | 2,607 | |
Civlian Workforce | 4,222 | 39,751 | 89,908 | |
Military Workforce | 9 | 82 | 187 | |
Total Households | 2,806 | 26,015 | 60,019 | |
Family Households | 1,983 | 18,225 | 42,266 | |
Non-Family Households | 823 | 7,790 | 17,753 | |
Married Couple | 1,633 | 14,905 | 35,673 | |
Other Family | 351 | 3,320 | 6,593 | |
Married w/Child | 922 | 7,916 | 17,565 | |
Single Male w/Child | 96 | 750 | 1,368 | |
Single Female w/Child | 143 | 1,419 | 2,930 |
Population Change Last Two Decades - Plus Projection
2000 | % | 2010 | % | 2020 | % | 2030 | |
---|---|---|---|---|---|---|---|
Indiana | 6,080,485 | +7 | 6,483,802 | +4 | 6,738,573 | +4 | 7,014,880 |
Hamilton County | 182,740 | +50 | 274,569 | +25 | 343,179 | +22 | 417,754 |
Hancock County | 55,391 | +26 | 70,002 | +9 | 76,353 | +11 | 85,043 |
Marion County | 860,454 | +5 | 903,393 | +7 | 963,732 | +4 | 1,001,231 |
Total Working Age Population:
Total Households:
Total Working Age Population:
Total Households:
Total Working Age Population:
Total Households: