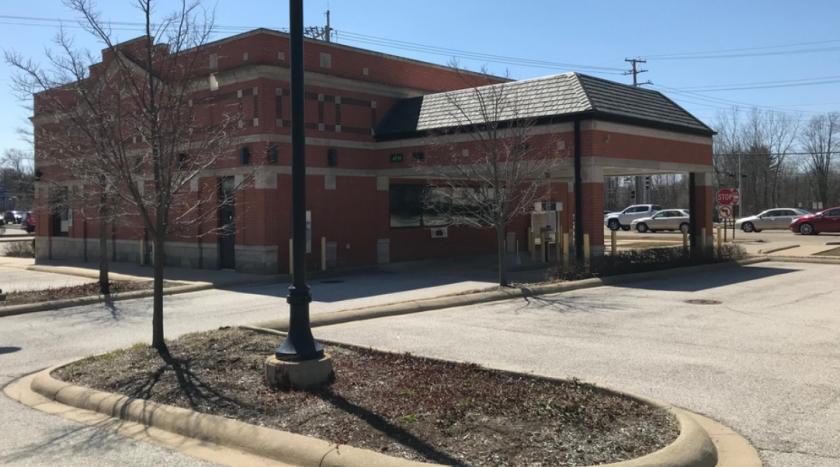
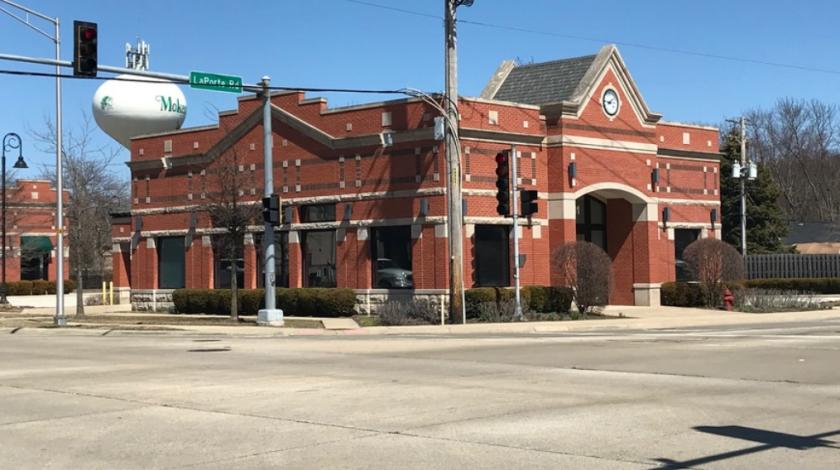
1-Mile | 3-Miles | 5-Miles | ||
---|---|---|---|---|
Total Population | 7,177 | 47,337 | 117,072 | |
Population Median Age | 40 | 40 | 40 | |
Population by Age | 0-9 Yrs | 805 (11%) | 5892 (12%) | 13799 (11%) |
10-19 Yrs | 868 (12%) | 6305 (13%) | 16440 (14%) | |
20-29 Yrs | 948 (13%) | 4989 (10%) | 12634 (10%) | |
30-39 Yrs | 844 (11%) | 4977 (10%) | 12303 (10%) | |
40-49 Yrs | 896 (12%) | 6006 (12%) | 15500 (13%) | |
50-59 Yrs | 1023 (14%) | 8217 (17%) | 20030 (17%) | |
60-69 Yrs | 1169 (16%) | 6123 (12%) | 15099 (12%) | |
70+ Yrs | 623 (8%) | 4829 (10%) | 11266 (9%) | |
Median HH Income | $102,092 | $112,995 | $110,858 | |
Total Household Income | < 24K | 162 (6%) | 1084 (6%) | 2286 (5%) |
25-49K | 323 (12%) | 1875 (11%) | 4710 (11%) | |
50-74K | 416 (15%) | 2073 (12%) | 5625 (13%) | |
75-99K | 405 (15%) | 2066 (12%) | 5321 (13%) | |
100-199K | 1016 (37%) | 6970 (42%) | 16211 (40%) | |
200K+ | 361 (13%) | 2442 (14%) | 6140 (15%) | |
Highest Education Level | No Diploma | 162 | 1274 | 3208 |
Diploma or GED | 1161 | 7417 | 18488 | |
Some College | 1064 | 6081 | 14975 | |
Assoc. Degree | 484 | 2895 | 7463 | |
Bachelors Degree | 1515 | 9106 | 22207 | |
Higher Degree | 725 | 5756 | 13835 | |
Total Housing Units | 2,727 | 17,027 | 41,740 | |
--Owner-Occupied | 2,268 | 15,157 | 37,428 | |
--Renter-Occupied | 415 | 1,353 | 2,865 | |
Owner-Occupied Values | < 100K | 55 | 379 | 1048 |
100-199K | 372 | 1792 | 5082 | |
200-299K | 779 | 4228 | 11687 | |
300-399K | 600 | 5061 | 11459 | |
400-499K | 346 | 2305 | 5285 | |
500K+ | 116 | 1392 | 2867 | |
Total Working Age Population | 5,848 | 37,616 | 92,969 | |
In Work Force | 4,064 | 25,530 | 64,138 | |
Not In Work Force | 1,784 | 12,086 | 28,831 | |
Workforce Employed | 3,919 | 24,641 | 61,668 | |
Workforce Unemployed | 145 | 889 | 2,470 | |
Civlian Workforce | 4,064 | 25,530 | 64,138 | |
Military Workforce | 0 | 0 | 0 | |
Total Households | 2,684 | 16,510 | 40,293 | |
Family Households | 1,863 | 12,798 | 31,637 | |
Non-Family Households | 820 | 3,712 | 8,656 | |
Married Couple | 1,555 | 11,468 | 27,999 | |
Other Family | 308 | 1,330 | 3,637 | |
Married w/Child | 601 | 4,738 | 11,457 | |
Single Male w/Child | 37 | 127 | 351 | |
Single Female w/Child | 99 | 477 | 1,277 |
Population Change Last Two Decades - Plus Projection
2000 | % | 2010 | % | 2020 | % | 2030 | |
---|---|---|---|---|---|---|---|
Illinois | 12,419,293 | +3 | 12,830,632 | +12 | 14,316,487 | +6 | 15,138,849 |
Cook County | 5,376,741 | -3 | 5,194,675 | +10 | 5,707,832 | +5 | 5,990,243 |
Will County | 502,266 | +35 | 677,560 | +34 | 907,625 | +20 | 1,093,207 |
Total Working Age Population:
Total Households:
Total Working Age Population:
Total Households:
Total Working Age Population:
Total Households: