Retail Space
4951 Sepulveda Boulevard Los Angeles, CA 91403
4951 Sepulveda Boulevard Los Angeles, CA 91403
Details & Description
Property Highlights
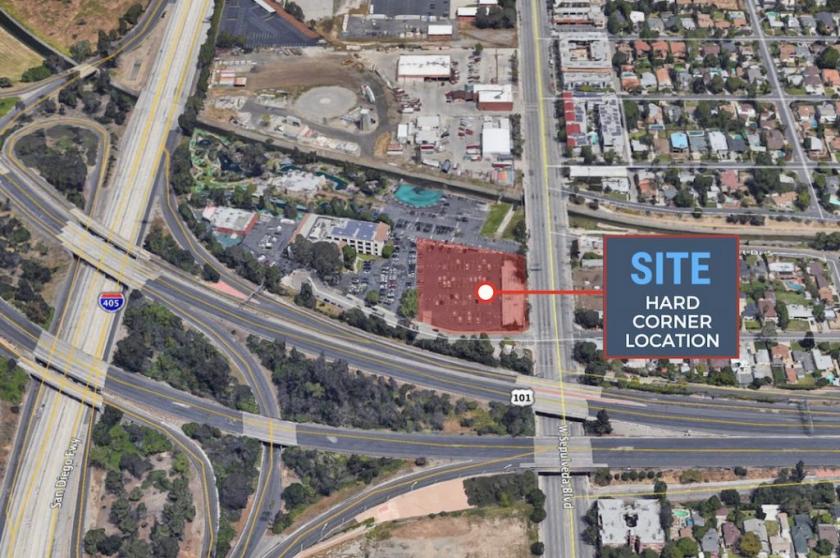
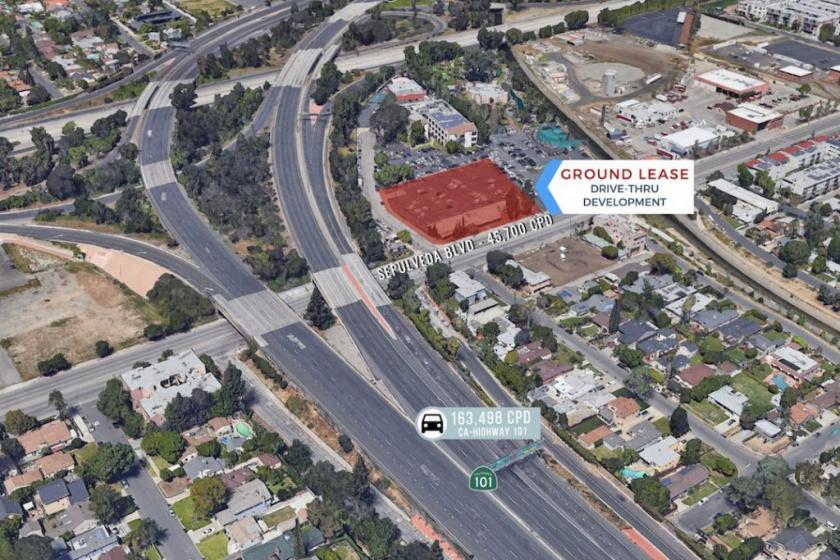
• Property located directly on Sepulveda Boulevard at busy CA101 Hwy onoff ramp visibility to over 45,000 CPD
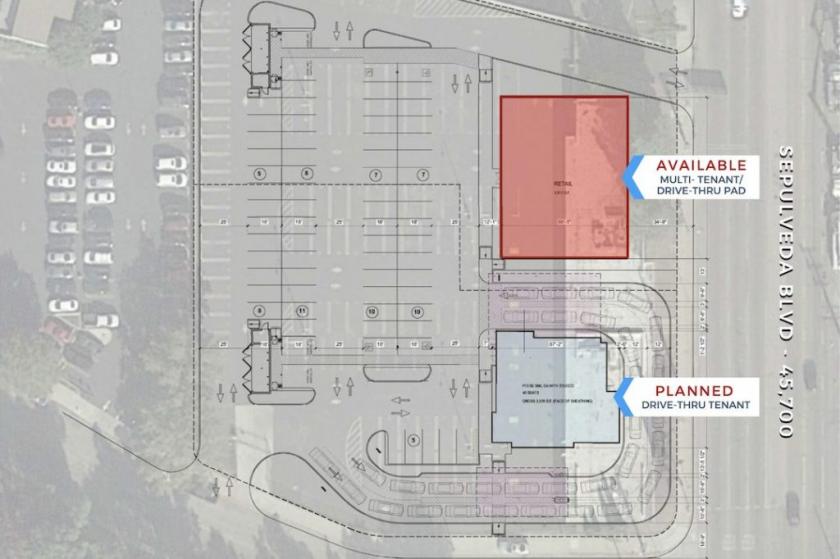
• Hard corner location planned single-tenant drive thru and multi-tenantdrive-thru pad unit
Listing Agents

Phil Berry
O: 949-723-7300
pberry@commercialwest.com
O: 949-723-7300
pberry@commercialwest.com
While we strive to provide the most accurate information, all listing information, and demographic data, is provided by third-parties. As such, MyEListing will not be responsible for the accuracy of the information. It is strongly recommended that you verify all information with the listing agent, and any relevant agencies, prior to making any decisions.