Retail Space
2233 East Katella Avenue Anaheim, CA 92806
2233 East Katella Avenue Anaheim, CA 92806

Details & Description
Property Highlights
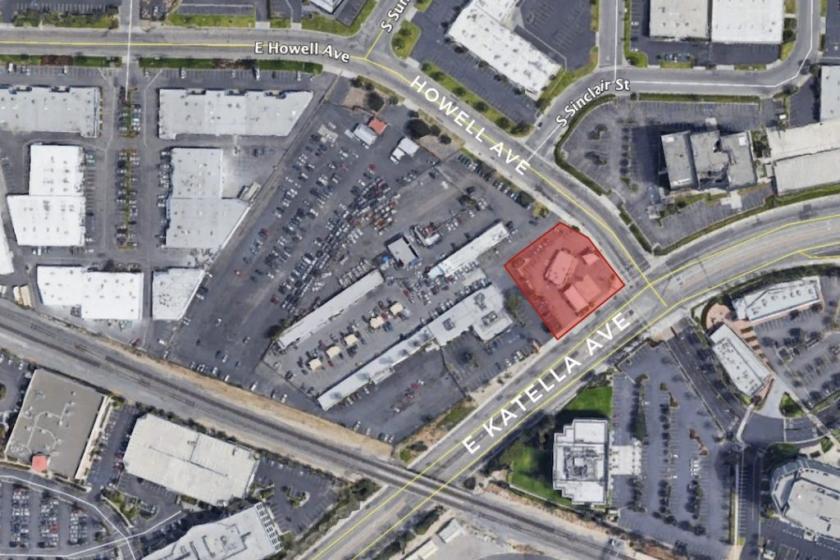
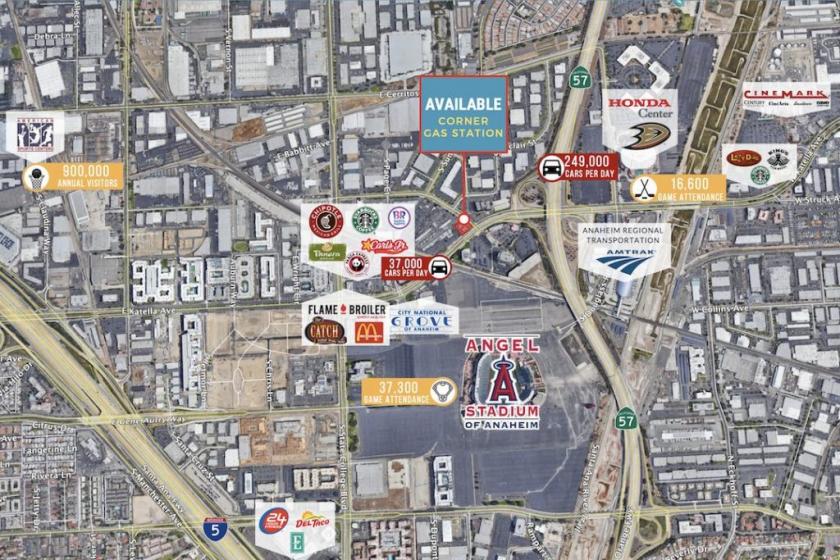
• Property located at the intersection of Katella Avenue and Howell Avenue, adjacent to Angel Stadium of Anaheim
• Densely populated area with strong daytime office and industrial population
Listing Agents

Phil Berry
O: 949-723-7300
pberry@commercialwest.com
O: 949-723-7300
pberry@commercialwest.com
While we strive to provide the most accurate information, all listing information, and demographic data, is provided by third-parties. As such, MyEListing will not be responsible for the accuracy of the information. It is strongly recommended that you verify all information with the listing agent, and any relevant agencies, prior to making any decisions.