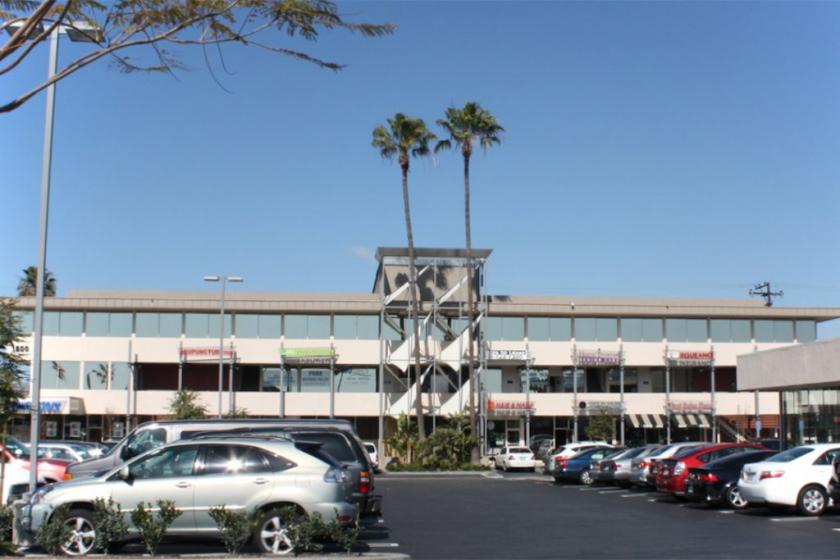
Retail Space
1500 Adams Avenue Costa Mesa, CA 92626
1500 Adams Avenue Costa Mesa, CA 92626
Details & Description
Property Highlights
• Visibility to over 69,000 cars per day on Harbor Blvd. and direct access from I-405
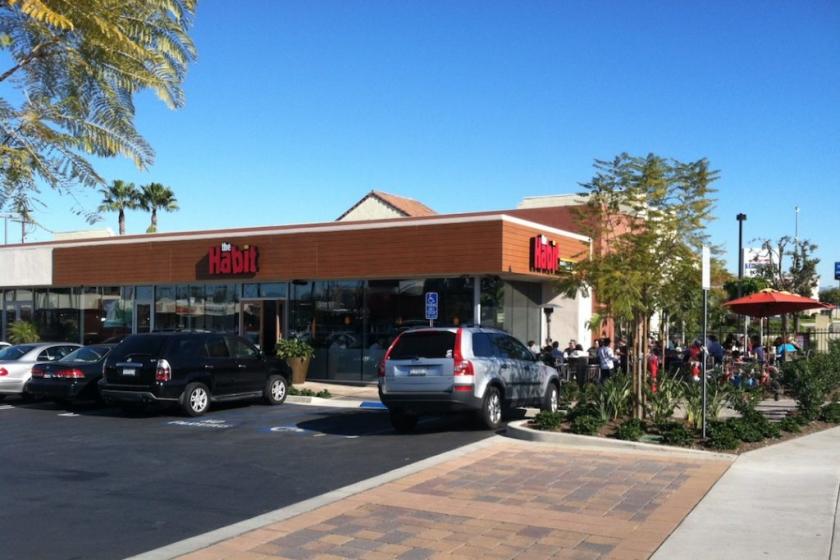
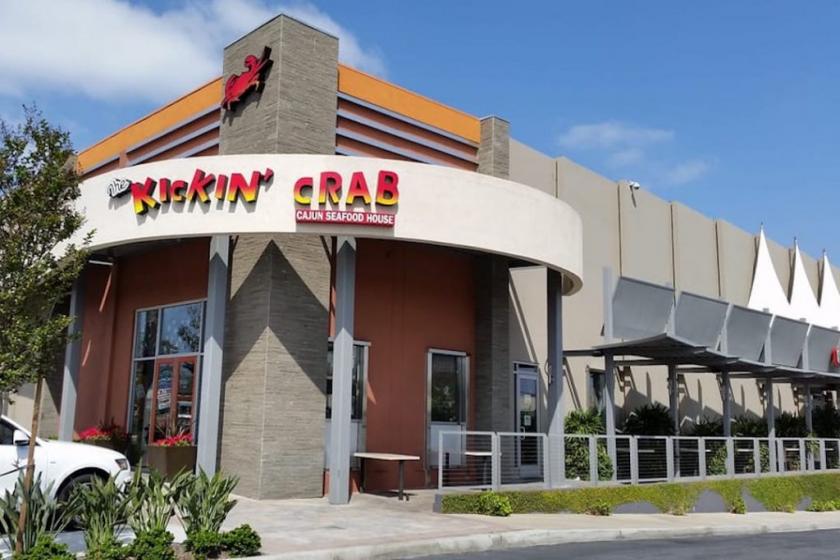
• Co-tenants include busy Habit Burger, Bon Chon, Maru Sushi and more
Listing Agents

Kate Berry
O: 949-723-7300
kate@commercialwest.com
O: 949-723-7300
kate@commercialwest.com
While we strive to provide the most accurate information, all listing information, and demographic data, is provided by third-parties. As such, MyEListing will not be responsible for the accuracy of the information. It is strongly recommended that you verify all information with the listing agent, and any relevant agencies, prior to making any decisions.