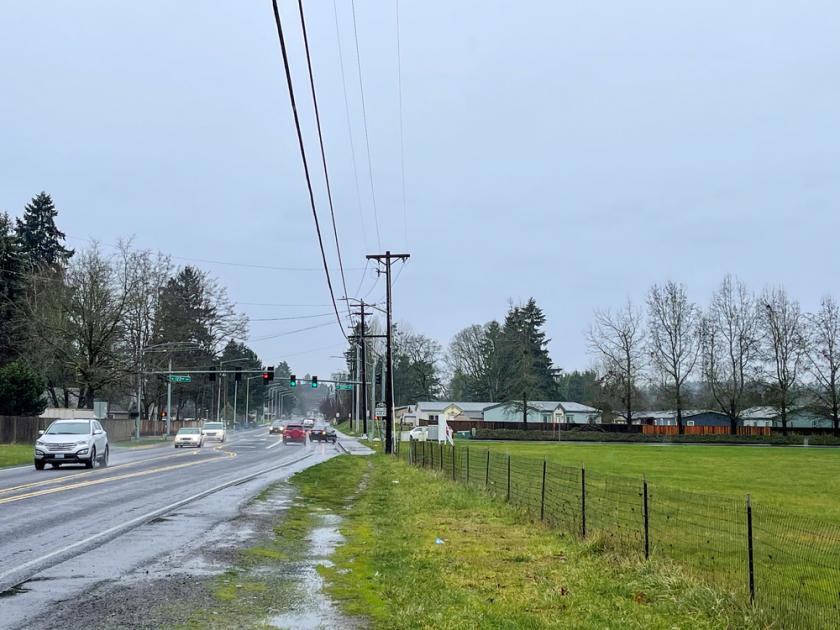
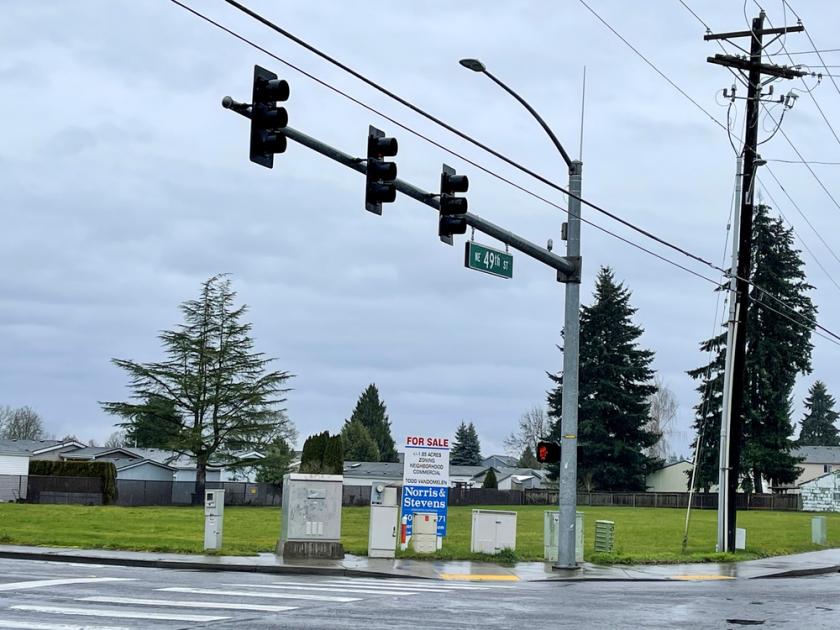
1-Mile | 3-Miles | 5-Miles | ||
---|---|---|---|---|
Total Population | 14,838 | 122,045 | 238,092 | |
Population Median Age | 35 | 37 | 38 | |
Population by Age | 0-9 Yrs | 2174 (14%) | 16270 (13%) | 31643 (13%) |
10-19 Yrs | 2020 (13%) | 16820 (13%) | 30650 (12%) | |
20-29 Yrs | 2571 (17%) | 18513 (15%) | 34302 (14%) | |
30-39 Yrs | 2368 (15%) | 17092 (14%) | 32864 (13%) | |
40-49 Yrs | 1737 (11%) | 15978 (13%) | 31170 (13%) | |
50-59 Yrs | 1481 (9%) | 14495 (11%) | 28743 (12%) | |
60-69 Yrs | 1395 (9%) | 12210 (10%) | 25985 (10%) | |
70+ Yrs | 1092 (7%) | 10666 (8%) | 22735 (9%) | |
Median HH Income | $64,530 | $66,404 | $68,466 | |
Total Household Income | < 24K | 736 (13%) | 6277 (14%) | 12173 (13%) |
25-49K | 1231 (23%) | 9680 (21%) | 18639 (20%) | |
50-74K | 1289 (24%) | 9753 (21%) | 18449 (20%) | |
75-99K | 973 (18%) | 6830 (15%) | 13515 (15%) | |
100-199K | 1015 (19%) | 10613 (23%) | 21806 (24%) | |
200K+ | 73 (1%) | 1532 (3%) | 4602 (5%) | |
Highest Education Level | No Diploma | 892 | 7192 | 13997 |
Diploma or GED | 3033 | 23129 | 41921 | |
Some College | 2617 | 23068 | 44341 | |
Assoc. Degree | 939 | 8886 | 17534 | |
Bachelors Degree | 1382 | 12794 | 28907 | |
Higher Degree | 545 | 5349 | 14048 | |
Total Housing Units | 5,663 | 46,379 | 92,861 | |
--Owner-Occupied | 3,096 | 27,440 | 54,022 | |
--Renter-Occupied | 2,220 | 17,245 | 35,162 | |
Owner-Occupied Values | < 100K | 510 | 1433 | 2333 |
100-199K | 593 | 3958 | 6751 | |
200-299K | 1360 | 12122 | 19998 | |
300-399K | 595 | 7076 | 14783 | |
400-499K | 7 | 1786 | 5434 | |
500K+ | 30 | 1064 | 4724 | |
Total Working Age Population | 11,344 | 95,455 | 187,688 | |
In Work Force | 7,988 | 64,565 | 124,519 | |
Not In Work Force | 3,355 | 30,890 | 63,169 | |
Workforce Employed | 7,514 | 60,659 | 117,497 | |
Workforce Unemployed | 471 | 3,714 | 6,675 | |
Civlian Workforce | 7,985 | 64,373 | 124,172 | |
Military Workforce | 4 | 192 | 347 | |
Total Households | 5,316 | 44,685 | 89,184 | |
Family Households | 3,460 | 29,743 | 59,400 | |
Non-Family Households | 1,856 | 14,942 | 29,784 | |
Married Couple | 2,464 | 21,786 | 44,382 | |
Other Family | 996 | 7,957 | 15,018 | |
Married w/Child | 1,102 | 9,259 | 18,317 | |
Single Male w/Child | 173 | 1,159 | 2,358 | |
Single Female w/Child | 505 | 3,111 | 5,629 |
Population Change Last Two Decades - Plus Projection
2000 | % | 2010 | % | 2020 | % | 2030 | |
---|---|---|---|---|---|---|---|
Oregon | 3,421,399 | +12 | 3,831,074 | +11 | 4,264,810 | +11 | 4,727,438 |
Multnomah County | 660,486 | +11 | 735,334 | +12 | 822,675 | +10 | 906,904 |
Washington | 5,894,121 | +14 | 6,724,540 | +14 | 7,638,415 | +11 | 8,503,178 |
Clark County | 345,238 | +23 | 425,363 | +17 | 499,400 | +16 | 576,879 |
Total Working Age Population:
Total Households:
Total Working Age Population:
Total Households:
Total Working Age Population:
Total Households: