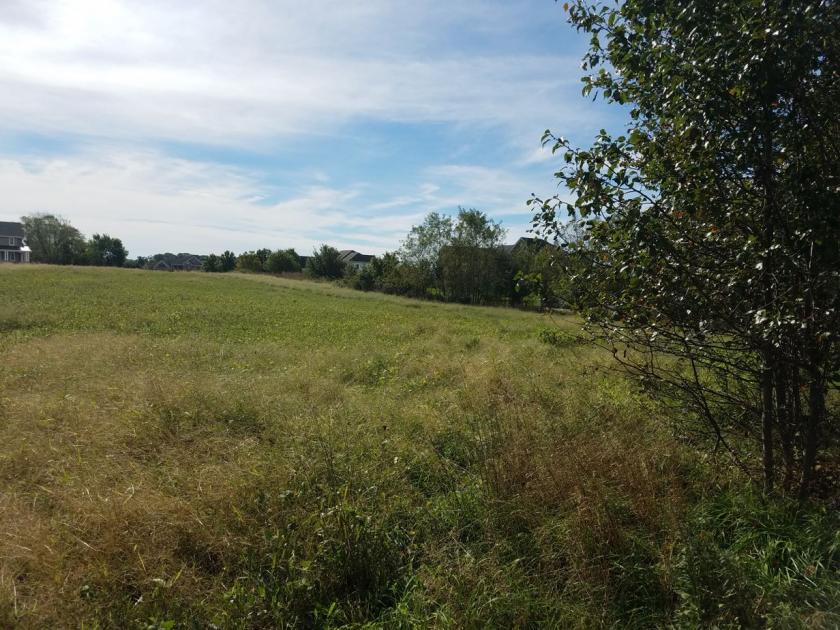
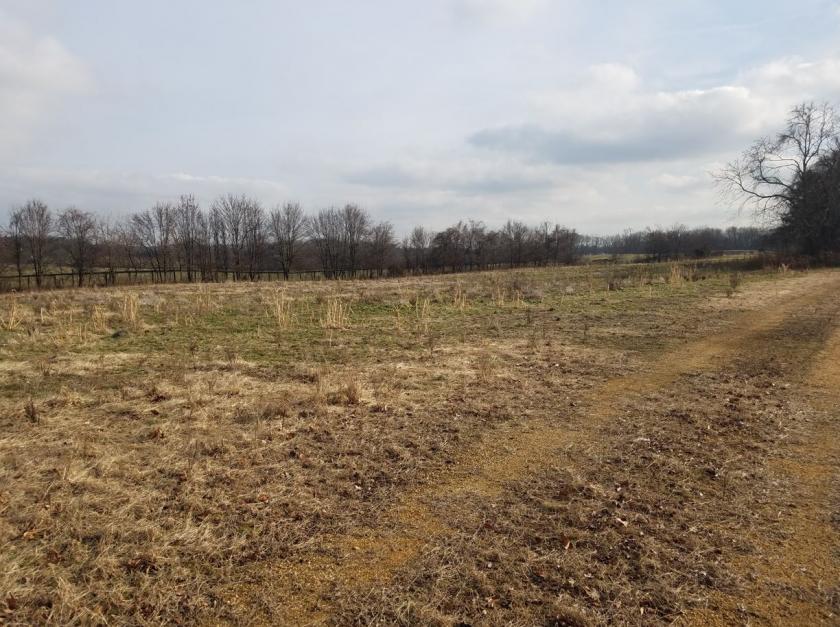
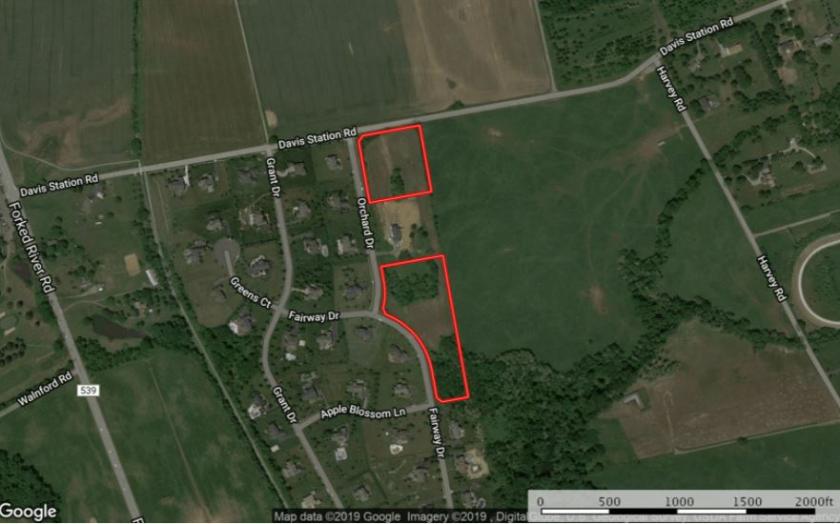
1-Mile | 3-Miles | 5-Miles | ||
---|---|---|---|---|
Total Population | 484 | 4,398 | 18,350 | |
Population Median Age | 43 | 44 | 42 | |
Population by Age | 0-9 Yrs | 59 (12%) | 534 (12%) | 1981 (10%) |
10-19 Yrs | 72 (14%) | 630 (14%) | 2644 (14%) | |
20-29 Yrs | 21 (4%) | 210 (4%) | 1593 (8%) | |
30-39 Yrs | 40 (8%) | 404 (9%) | 1782 (9%) | |
40-49 Yrs | 67 (13%) | 567 (12%) | 2519 (13%) | |
50-59 Yrs | 73 (15%) | 630 (14%) | 3021 (16%) | |
60-69 Yrs | 83 (17%) | 737 (16%) | 2628 (14%) | |
70+ Yrs | 69 (14%) | 686 (15%) | 2182 (11%) | |
Median HH Income | $143,246 | $139,029 | $122,674 | |
Total Household Income | < 24K | 22 (12%) | 180 (11%) | 545 (8%) |
25-49K | 8 (4%) | 80 (4%) | 660 (9%) | |
50-74K | 21 (11%) | 189 (11%) | 784 (11%) | |
75-99K | 14 (7%) | 149 (9%) | 697 (10%) | |
100-199K | 51 (28%) | 491 (30%) | 2250 (34%) | |
200K+ | 61 (34%) | 535 (32%) | 1668 (25%) | |
Highest Education Level | No Diploma | 7 | 68 | 550 |
Diploma or GED | 79 | 637 | 3041 | |
Some College | 67 | 544 | 1998 | |
Assoc. Degree | 22 | 225 | 1081 | |
Bachelors Degree | 88 | 865 | 3557 | |
Higher Degree | 81 | 784 | 2530 | |
Total Housing Units | 191 | 1,740 | 6,919 | |
--Owner-Occupied | 164 | 1,528 | 6,061 | |
--Renter-Occupied | 13 | 96 | 543 | |
Owner-Occupied Values | < 100K | 1 | 11 | 124 |
100-199K | 0 | 0 | 258 | |
200-299K | 10 | 74 | 706 | |
300-399K | 41 | 390 | 1551 | |
400-499K | 35 | 336 | 1360 | |
500K+ | 77 | 716 | 2062 | |
Total Working Age Population | 387 | 3,525 | 14,913 | |
In Work Force | 257 | 2,302 | 10,026 | |
Not In Work Force | 130 | 1,222 | 4,887 | |
Workforce Employed | 247 | 2,210 | 9,557 | |
Workforce Unemployed | 9 | 84 | 447 | |
Civlian Workforce | 256 | 2,294 | 10,003 | |
Military Workforce | 1 | 8 | 23 | |
Total Households | 177 | 1,624 | 6,604 | |
Family Households | 143 | 1,314 | 5,303 | |
Non-Family Households | 34 | 310 | 1,301 | |
Married Couple | 126 | 1,168 | 4,605 | |
Other Family | 17 | 146 | 698 | |
Married w/Child | 45 | 404 | 1,779 | |
Single Male w/Child | 1 | 11 | 68 | |
Single Female w/Child | 7 | 49 | 181 |
Population Change Last Two Decades - Plus Projection
2000 | % | 2010 | % | 2020 | % | 2030 | |
---|---|---|---|---|---|---|---|
New Jersey | 8,414,350 | +4 | 8,791,894 | +4 | 9,132,700 | +4 | 9,530,900 |
Burlington County | 423,394 | +6 | 448,734 | 0 | 450,000 | +3 | 464,900 |
Mercer County | 350,761 | +4 | 366,513 | +3 | 379,000 | +5 | 397,400 |
Monmouth County | 615,301 | +2 | 630,380 | 0 | 633,400 | +3 | 655,300 |
Ocean County | 510,916 | +13 | 576,567 | +4 | 600,300 | +7 | 644,100 |
Total Working Age Population:
Total Households:
Total Working Age Population:
Total Households:
Total Working Age Population:
Total Households: