Retail Space
703 West Marshall Howard Boulevard Littlefield, TX 79339
703 West Marshall Howard Boulevard Littlefield, TX 79339

Details & Description
Property Highlights
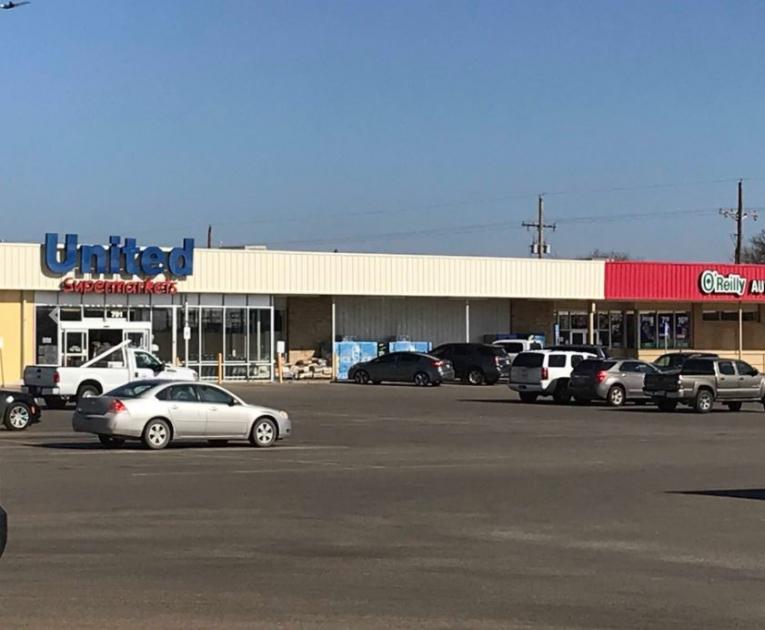
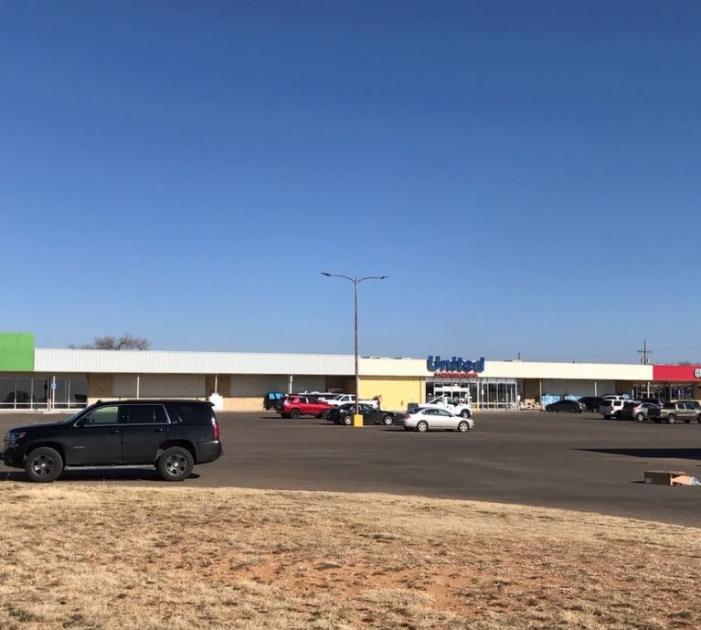
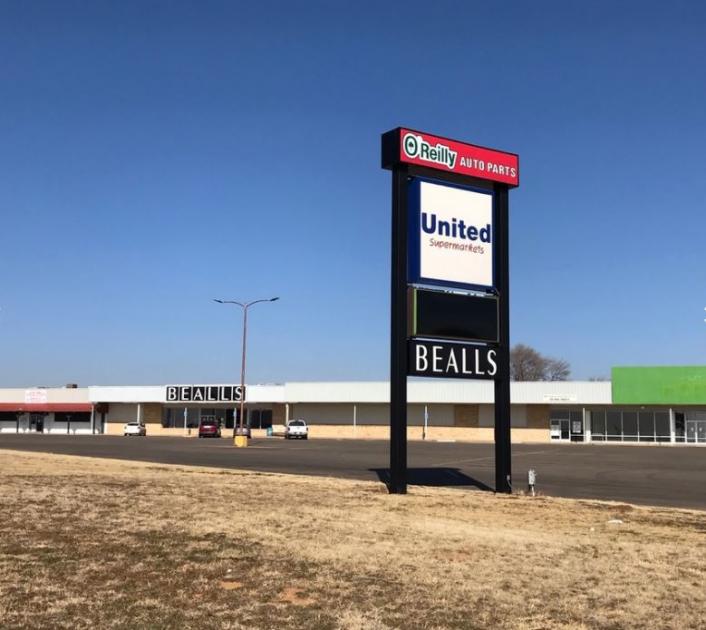
• Strong co-tenants include United Supermarkets, OReilly Auto Parts Dollar Tree
• Spaces can be easily divided to meet square footage requirements
Additional Photos
Listing Agents

Brice Kelly
O: 806-368-6554
M: 512-560-3241
brice@bradandrewsrealty.com
O: 806-368-6554
M: 512-560-3241
brice@bradandrewsrealty.com
While we strive to provide the most accurate information, all listing information, and demographic data, is provided by third-parties. As such, MyEListing will not be responsible for the accuracy of the information. It is strongly recommended that you verify all information with the listing agent, and any relevant agencies, prior to making any decisions.


