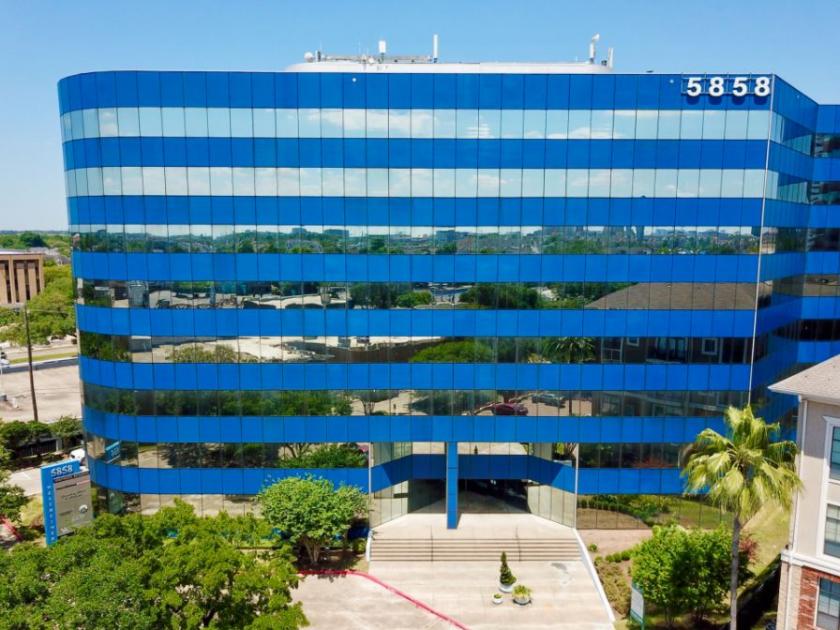
1-Mile | 3-Miles | 5-Miles | ||
---|---|---|---|---|
Total Population | 32,559 | 210,993 | 510,735 | |
Population Median Age | 37 | 36 | 36 | |
Population by Age | 0-9 Yrs | 4179 (12%) | 30381 (14%) | 70652 (13%) |
10-19 Yrs | 2133 (6%) | 20752 (9%) | 55200 (10%) | |
20-29 Yrs | 6486 (19%) | 37507 (17%) | 83212 (16%) | |
30-39 Yrs | 6668 (20%) | 39727 (18%) | 91206 (17%) | |
40-49 Yrs | 4466 (13%) | 27054 (12%) | 67495 (13%) | |
50-59 Yrs | 3358 (10%) | 22182 (10%) | 57443 (11%) | |
60-69 Yrs | 2649 (8%) | 17087 (8%) | 45613 (8%) | |
70+ Yrs | 2619 (8%) | 16304 (7%) | 39913 (7%) | |
Median HH Income | $67,693 | $59,210 | $66,527 | |
Total Household Income | < 24K | 2821 (17%) | 19895 (21%) | 42134 (19%) |
25-49K | 3219 (20%) | 19886 (21%) | 42778 (20%) | |
50-74K | 2519 (15%) | 13180 (14%) | 30707 (14%) | |
75-99K | 1811 (11%) | 9315 (10%) | 21115 (9%) | |
100-199K | 3387 (21%) | 15340 (16%) | 38729 (18%) | |
200K+ | 2085 (13%) | 13882 (15%) | 37874 (17%) | |
Highest Education Level | No Diploma | 2051 | 21843 | 49609 |
Diploma or GED | 2530 | 21563 | 50982 | |
Some College | 3837 | 20134 | 47313 | |
Assoc. Degree | 1184 | 7399 | 16260 | |
Bachelors Degree | 8747 | 44334 | 104614 | |
Higher Degree | 5737 | 31027 | 84239 | |
Total Housing Units | 18,358 | 105,164 | 243,110 | |
--Owner-Occupied | 4,981 | 27,693 | 83,210 | |
--Renter-Occupied | 10,860 | 63,806 | 130,126 | |
Owner-Occupied Values | < 100K | 287 | 2225 | 5950 |
100-199K | 934 | 3767 | 10950 | |
200-299K | 629 | 2906 | 9045 | |
300-399K | 684 | 2153 | 9806 | |
400-499K | 439 | 1537 | 7475 | |
500K+ | 2008 | 15105 | 39984 | |
Total Working Age Population | 26,753 | 166,975 | 404,598 | |
In Work Force | 20,645 | 119,678 | 285,722 | |
Not In Work Force | 6,108 | 47,297 | 118,875 | |
Workforce Employed | 19,780 | 115,031 | 273,816 | |
Workforce Unemployed | 865 | 4,646 | 11,751 | |
Civlian Workforce | 20,645 | 119,678 | 285,567 | |
Military Workforce | 0 | 0 | 155 | |
Total Households | 15,841 | 91,498 | 213,336 | |
Family Households | 7,023 | 48,028 | 119,455 | |
Non-Family Households | 8,818 | 43,471 | 93,881 | |
Married Couple | 5,125 | 34,484 | 87,651 | |
Other Family | 1,898 | 13,543 | 31,804 | |
Married w/Child | 2,412 | 15,941 | 39,772 | |
Single Male w/Child | 325 | 2,043 | 4,221 | |
Single Female w/Child | 467 | 5,226 | 12,853 |
Population Change Last Two Decades - Plus Projection
2000 | % | 2010 | % | 2020 | % | 2030 | |
---|---|---|---|---|---|---|---|
Texas | 20,851,820 | +21 | 25,145,561 | +18 | 29,677,668 | +18 | 34,894,452 |
Fort Bend County | 354,452 | +65 | 585,375 | +44 | 840,383 | +43 | 1,203,029 |
Harris County | 3,400,578 | +20 | 4,092,459 | +22 | 4,978,845 | +19 | 5,924,750 |
Total Working Age Population:
Total Households:
Total Working Age Population:
Total Households:
Total Working Age Population:
Total Households: