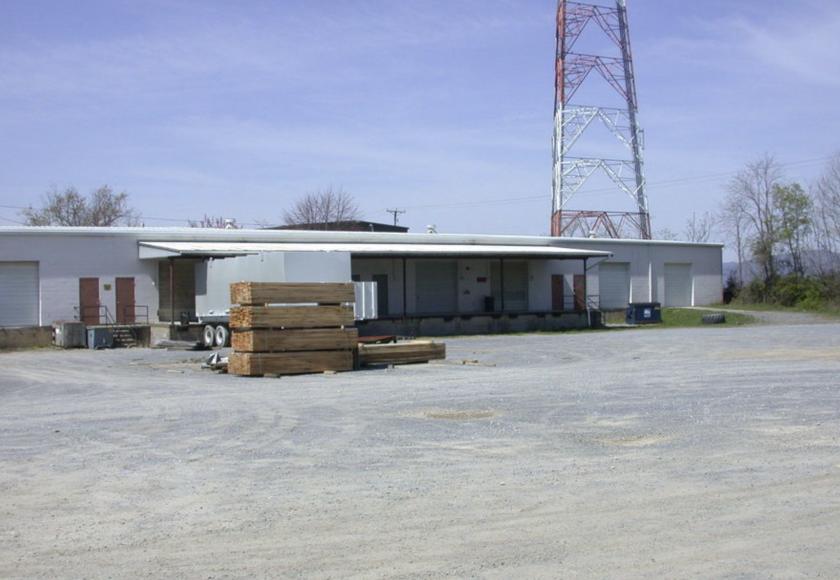
Industrial Properties
2836 Nicholas Avenue Northeast Roanoke, VA 24012
2836 Nicholas Avenue Northeast Roanoke, VA 24012
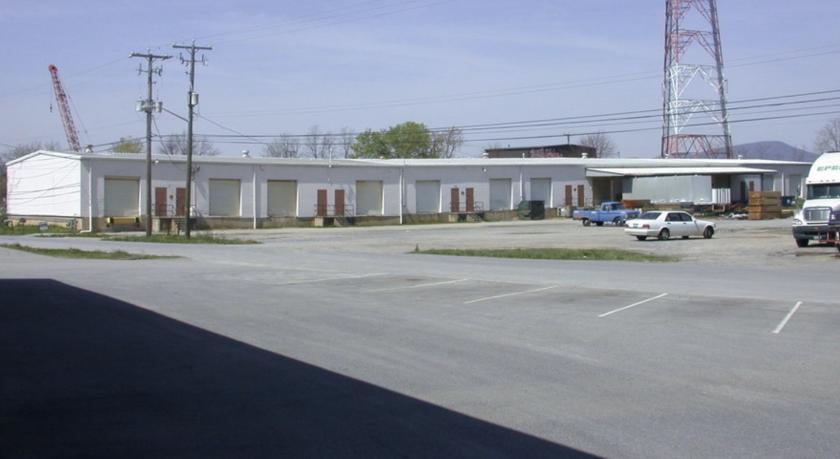
Details & Description
Property Highlights
- • Ample Parking
- • Low Lease Rate
- • Established Industrial Park
- • Easy Access
Listing Agents

Peter Ostaseski
O: 540-855-3641
M: 540-353-2661
postaseski@poecronk.com
O: 540-855-3641
M: 540-353-2661
postaseski@poecronk.com
While we strive to provide the most accurate information, all listing information, and demographic data, is provided by third-parties. As such, MyEListing will not be responsible for the accuracy of the information. It is strongly recommended that you verify all information with the listing agent, and any relevant agencies, prior to making any decisions.