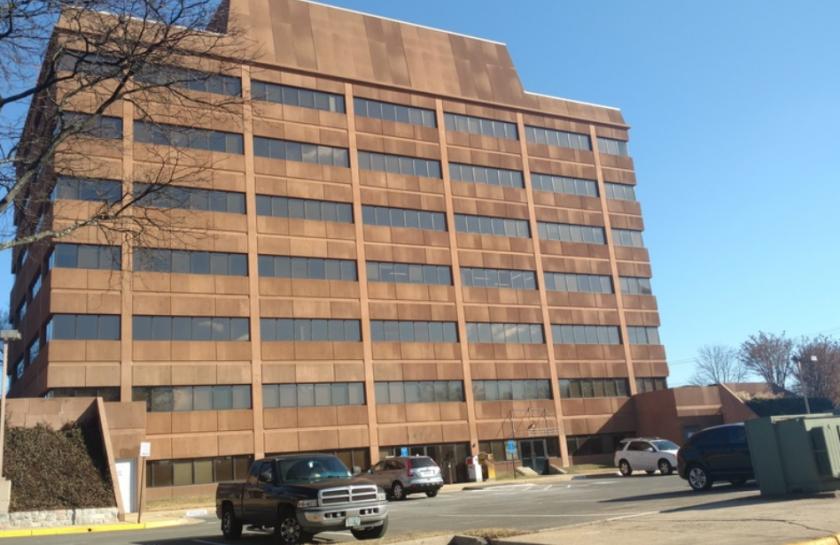
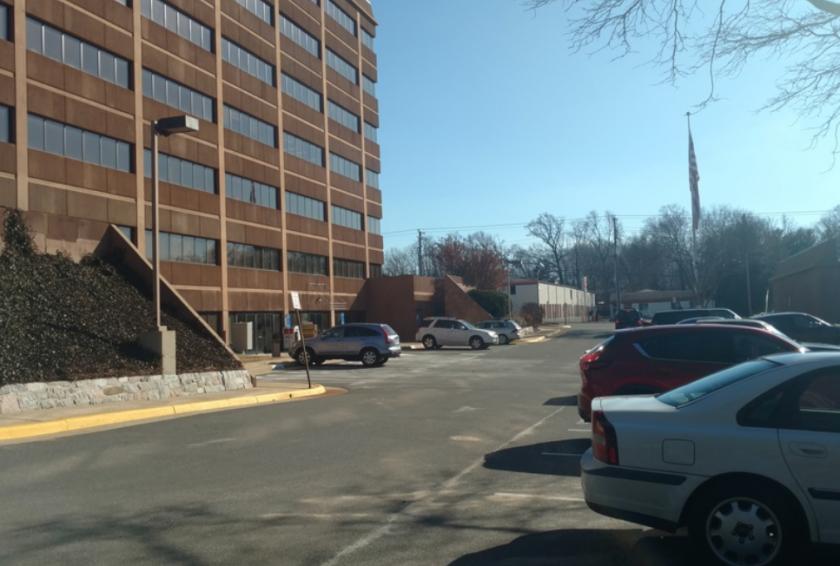
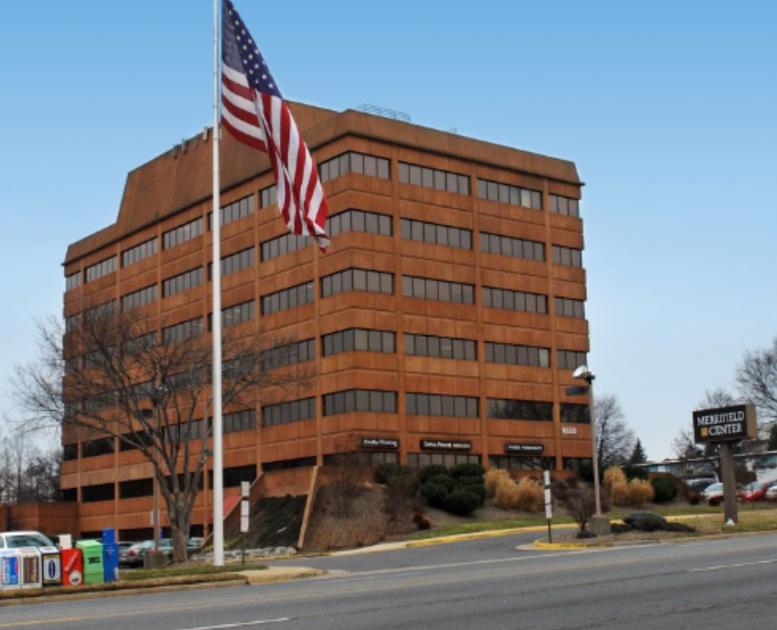
1-Mile | 3-Miles | 5-Miles | ||
---|---|---|---|---|
Total Population | 14,216 | 135,685 | 339,537 | |
Population Median Age | 37 | 38 | 38 | |
Population by Age | 0-9 Yrs | 1652 (11%) | 16753 (12%) | 42427 (12%) |
10-19 Yrs | 1049 (7%) | 15985 (11%) | 43090 (12%) | |
20-29 Yrs | 2756 (19%) | 18858 (13%) | 44341 (13%) | |
30-39 Yrs | 3113 (21%) | 22517 (16%) | 51076 (15%) | |
40-49 Yrs | 1712 (12%) | 19416 (14%) | 47323 (13%) | |
50-59 Yrs | 1661 (11%) | 17941 (13%) | 44738 (13%) | |
60-69 Yrs | 1174 (8%) | 13460 (9%) | 35858 (10%) | |
70+ Yrs | 1099 (7%) | 10755 (7%) | 30685 (9%) | |
Median HH Income | $124,065 | $125,245 | $128,313 | |
Total Household Income | < 24K | 326 (5%) | 3883 (7%) | 9207 (7%) |
25-49K | 592 (9%) | 4445 (9%) | 11346 (9%) | |
50-74K | 593 (9%) | 5350 (10%) | 12293 (10%) | |
75-99K | 807 (13%) | 5810 (11%) | 13103 (10%) | |
100-199K | 2467 (40%) | 17026 (34%) | 40754 (34%) | |
200K+ | 1249 (20%) | 12772 (25%) | 32952 (27%) | |
Highest Education Level | No Diploma | 607 | 7426 | 17346 |
Diploma or GED | 895 | 10527 | 26305 | |
Some College | 762 | 10117 | 25726 | |
Assoc. Degree | 440 | 5043 | 11041 | |
Bachelors Degree | 4113 | 29912 | 72254 | |
Higher Degree | 3736 | 31630 | 79566 | |
Total Housing Units | 6,675 | 51,831 | 125,525 | |
--Owner-Occupied | 2,657 | 29,819 | 78,099 | |
--Renter-Occupied | 3,376 | 19,467 | 41,556 | |
Owner-Occupied Values | < 100K | 29 | 296 | 775 |
100-199K | 22 | 758 | 1897 | |
200-299K | 109 | 1740 | 3847 | |
300-399K | 307 | 2143 | 5317 | |
400-499K | 483 | 4352 | 10841 | |
500K+ | 1707 | 20532 | 55422 | |
Total Working Age Population | 12,049 | 109,331 | 271,649 | |
In Work Force | 9,296 | 80,378 | 193,221 | |
Not In Work Force | 2,752 | 28,953 | 78,429 | |
Workforce Employed | 9,071 | 77,308 | 184,344 | |
Workforce Unemployed | 156 | 2,449 | 7,280 | |
Civlian Workforce | 9,226 | 79,757 | 191,624 | |
Military Workforce | 70 | 621 | 1,597 | |
Total Households | 6,034 | 49,286 | 119,655 | |
Family Households | 3,211 | 33,066 | 82,809 | |
Non-Family Households | 2,823 | 16,220 | 36,846 | |
Married Couple | 2,708 | 26,713 | 67,767 | |
Other Family | 503 | 6,353 | 15,042 | |
Married w/Child | 1,144 | 12,627 | 32,283 | |
Single Male w/Child | 83 | 905 | 1,924 | |
Single Female w/Child | 134 | 2,030 | 5,116 |
Population Change Last Two Decades - Plus Projection
2000 | % | 2010 | % | 2020 | % | 2030 | |
---|---|---|---|---|---|---|---|
Maryland | 5,296,486 | +9 | 5,773,552 | +6 | 6,141,900 | +6 | 6,518,750 |
Montgomery County | 873,341 | +11 | 971,777 | +8 | 1,052,050 | +7 | 1,128,800 |
Virginia | 7,078,515 | +13 | 8,001,024 | +8 | 8,655,021 | +8 | 9,331,666 |
Arlington County | 189,453 | +10 | 207,627 | +20 | 249,298 | +10 | 274,339 |
Fairfax County | 969,749 | +12 | 1,081,726 | +7 | 1,162,504 | +7 | 1,244,025 |
Loudoun County | 169,599 | +84 | 312,311 | +38 | 430,584 | +29 | 554,808 |
Prince William County | 280,813 | +43 | 402,002 | +19 | 478,134 | +20 | 571,844 |
Fairfax city | 21,498 | +5 | 22,565 | +11 | 25,047 | +5 | 26,397 |
Falls Church city | 10,377 | +19 | 12,332 | +22 | 14,988 | +14 | 17,032 |
Total Working Age Population:
Total Households:
Total Working Age Population:
Total Households:
Total Working Age Population:
Total Households: