Commercial Land
2802 New Jersey 138 Farmingdale, NJ 07727
2802 New Jersey 138 Farmingdale, NJ 07727
Details & Description
Property Highlights
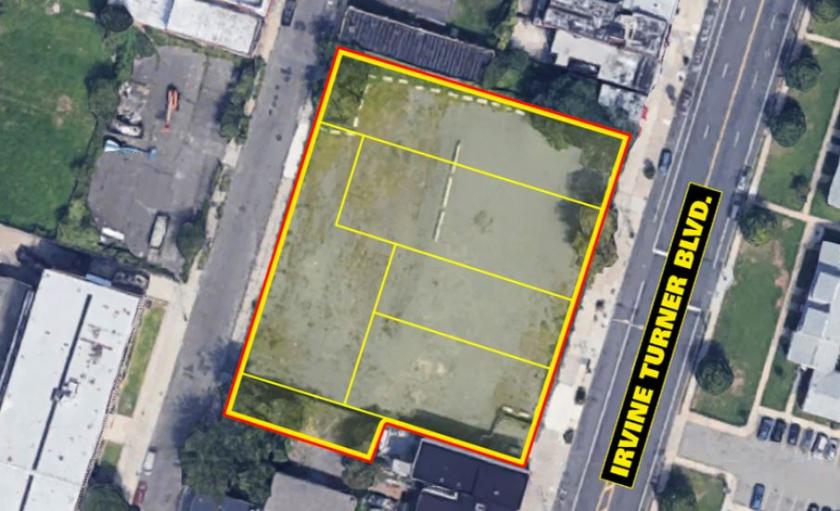
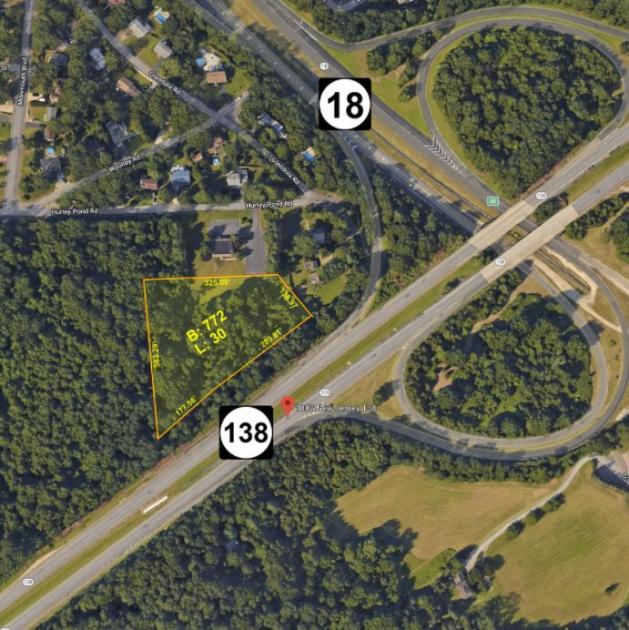
- • Route 138 frontage, visibility, and address
- • Great visibility
- • No wetlands shown on NJ.gov map
- • Zoned OP-2
Listing Agents

Joseph Allegro
O: 732-623-2145
M: 201-988-5534
allegro@sitarcompany.com
O: 732-623-2145
M: 201-988-5534
allegro@sitarcompany.com
While we strive to provide the most accurate information, all listing information, and demographic data, is provided by third-parties. As such, MyEListing will not be responsible for the accuracy of the information. It is strongly recommended that you verify all information with the listing agent, and any relevant agencies, prior to making any decisions.