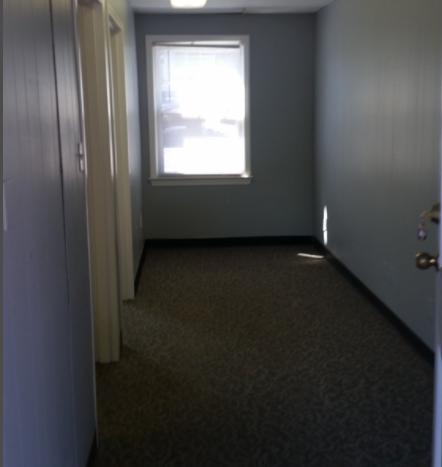
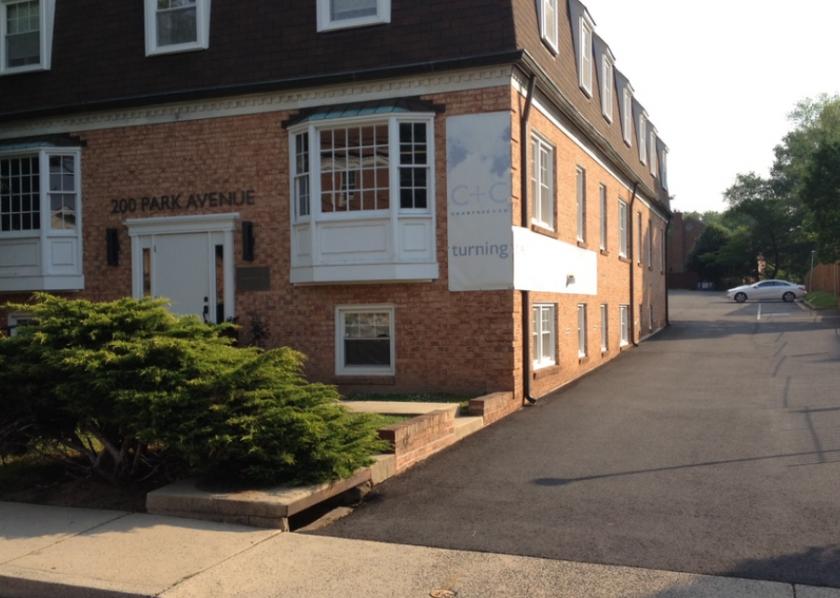
1-Mile | 3-Miles | 5-Miles | ||
---|---|---|---|---|
Total Population | 21,674 | 165,305 | 477,767 | |
Population Median Age | 37 | 38 | 37 | |
Population by Age | 0-9 Yrs | 3199 (14%) | 23337 (14%) | 60889 (12%) |
10-19 Yrs | 2491 (11%) | 19409 (11%) | 49845 (10%) | |
20-29 Yrs | 2653 (12%) | 20083 (12%) | 71806 (15%) | |
30-39 Yrs | 3174 (14%) | 25447 (15%) | 84208 (17%) | |
40-49 Yrs | 3269 (15%) | 24858 (15%) | 66933 (14%) | |
50-59 Yrs | 2935 (13%) | 21333 (12%) | 57846 (12%) | |
60-69 Yrs | 2422 (11%) | 17102 (10%) | 46700 (9%) | |
70+ Yrs | 1532 (7%) | 13735 (8%) | 39539 (8%) | |
Median HH Income | $135,172 | $132,275 | $116,065 | |
Total Household Income | < 24K | 593 (7%) | 4602 (7%) | 16951 (9%) |
25-49K | 716 (8%) | 6077 (10%) | 19986 (10%) | |
50-74K | 669 (8%) | 5833 (9%) | 22353 (11%) | |
75-99K | 849 (10%) | 6053 (10%) | 21836 (11%) | |
100-199K | 2845 (34%) | 18735 (31%) | 59694 (31%) | |
200K+ | 2529 (30%) | 17874 (30%) | 45847 (24%) | |
Highest Education Level | No Diploma | 553 | 10629 | 29170 |
Diploma or GED | 1298 | 12731 | 37548 | |
Some College | 1576 | 10846 | 35204 | |
Assoc. Degree | 641 | 4721 | 14781 | |
Bachelors Degree | 4938 | 34620 | 105673 | |
Higher Degree | 5849 | 40447 | 116318 | |
Total Housing Units | 8,688 | 62,194 | 197,464 | |
--Owner-Occupied | 4,997 | 38,737 | 98,525 | |
--Renter-Occupied | 3,205 | 20,436 | 88,142 | |
Owner-Occupied Values | < 100K | 8 | 216 | 712 |
100-199K | 129 | 1314 | 3779 | |
200-299K | 185 | 1425 | 6711 | |
300-399K | 207 | 1780 | 7674 | |
400-499K | 460 | 3579 | 11313 | |
500K+ | 4008 | 30423 | 68337 | |
Total Working Age Population | 16,793 | 129,648 | 385,499 | |
In Work Force | 12,647 | 94,340 | 285,958 | |
Not In Work Force | 4,147 | 35,308 | 99,541 | |
Workforce Employed | 12,128 | 90,522 | 273,999 | |
Workforce Unemployed | 421 | 3,076 | 9,089 | |
Civlian Workforce | 12,549 | 93,598 | 283,088 | |
Military Workforce | 98 | 743 | 2,870 | |
Total Households | 8,202 | 59,173 | 186,667 | |
Family Households | 5,464 | 40,956 | 109,454 | |
Non-Family Households | 2,738 | 18,218 | 77,212 | |
Married Couple | 4,343 | 33,334 | 86,492 | |
Other Family | 1,120 | 7,622 | 22,962 | |
Married w/Child | 2,260 | 16,992 | 41,887 | |
Single Male w/Child | 110 | 1,090 | 2,619 | |
Single Female w/Child | 580 | 2,441 | 8,170 |
Population Change Last Two Decades - Plus Projection
2000 | % | 2010 | % | 2020 | % | 2030 | |
---|---|---|---|---|---|---|---|
District of Columbia | 572,059 | +5 | 601,723 | +21 | 729,501 | +15 | 842,154 |
Maryland | 5,296,486 | +9 | 5,773,552 | +6 | 6,141,900 | +6 | 6,518,750 |
Montgomery County | 873,341 | +11 | 971,777 | +8 | 1,052,050 | +7 | 1,128,800 |
Prince Georges County | 801,515 | +8 | 863,420 | +6 | 916,150 | +4 | 952,950 |
Virginia | 7,078,515 | +13 | 8,001,024 | +8 | 8,655,021 | +8 | 9,331,666 |
Arlington County | 189,453 | +10 | 207,627 | +20 | 249,298 | +10 | 274,339 |
Fairfax County | 969,749 | +12 | 1,081,726 | +7 | 1,162,504 | +7 | 1,244,025 |
Prince William County | 280,813 | +43 | 402,002 | +19 | 478,134 | +20 | 571,844 |
Alexandria city | 128,283 | +9 | 139,966 | +19 | 166,261 | +10 | 182,067 |
Falls Church city | 10,377 | +19 | 12,332 | +22 | 14,988 | +14 | 17,032 |
Total Working Age Population:
Total Households:
Total Working Age Population:
Total Households:
Total Working Age Population:
Total Households: