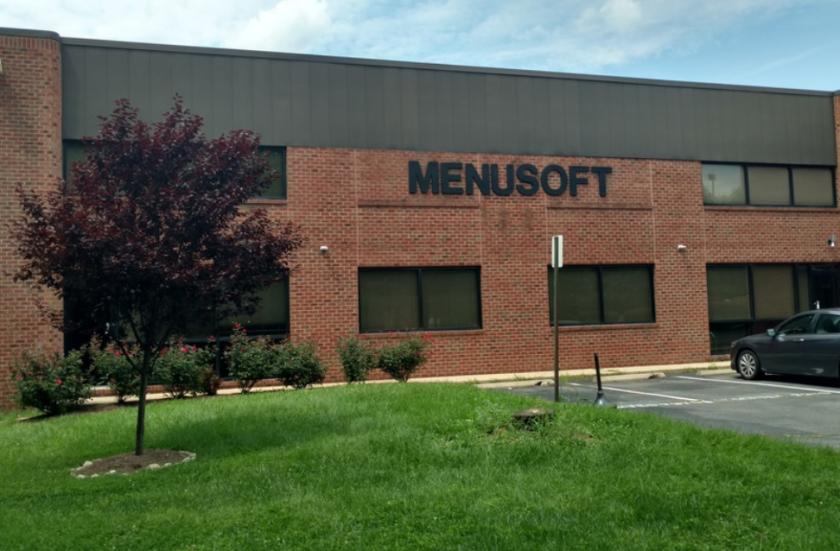
1-Mile | 3-Miles | 5-Miles | ||
---|---|---|---|---|
Total Population | 14,908 | 128,005 | 374,726 | |
Population Median Age | 38 | 39 | 38 | |
Population by Age | 0-9 Yrs | 1916 (12%) | 15975 (12%) | 48142 (12%) |
10-19 Yrs | 1703 (11%) | 16011 (12%) | 44767 (11%) | |
20-29 Yrs | 2306 (15%) | 15603 (12%) | 45065 (12%) | |
30-39 Yrs | 2290 (15%) | 19401 (15%) | 59208 (15%) | |
40-49 Yrs | 1927 (12%) | 17069 (13%) | 51949 (13%) | |
50-59 Yrs | 2019 (13%) | 17463 (13%) | 51577 (13%) | |
60-69 Yrs | 1322 (8%) | 13559 (10%) | 40090 (10%) | |
70+ Yrs | 1424 (9%) | 12924 (10%) | 33928 (9%) | |
Median HH Income | $110,030 | $111,357 | $114,273 | |
Total Household Income | < 24K | 351 (8%) | 3375 (8%) | 9617 (7%) |
25-49K | 486 (11%) | 5219 (12%) | 14601 (11%) | |
50-74K | 599 (14%) | 5330 (12%) | 15956 (12%) | |
75-99K | 421 (10%) | 4921 (11%) | 16365 (12%) | |
100-199K | 1683 (40%) | 15974 (38%) | 48171 (37%) | |
200K+ | 605 (14%) | 7197 (17%) | 24920 (19%) | |
Highest Education Level | No Diploma | 2083 | 11096 | 24610 |
Diploma or GED | 1982 | 15007 | 40150 | |
Some College | 1483 | 13236 | 37977 | |
Assoc. Degree | 696 | 5466 | 16989 | |
Bachelors Degree | 2393 | 24169 | 74494 | |
Higher Degree | 1555 | 19559 | 67018 | |
Total Housing Units | 4,328 | 43,394 | 135,103 | |
--Owner-Occupied | 3,127 | 28,857 | 87,214 | |
--Renter-Occupied | 1,018 | 13,159 | 42,415 | |
Owner-Occupied Values | < 100K | 54 | 431 | 1108 |
100-199K | 36 | 1012 | 3262 | |
200-299K | 46 | 1951 | 6305 | |
300-399K | 479 | 4507 | 13227 | |
400-499K | 1455 | 8672 | 20873 | |
500K+ | 1057 | 12284 | 42440 | |
Total Working Age Population | 11,890 | 102,519 | 298,862 | |
In Work Force | 8,598 | 72,394 | 214,520 | |
Not In Work Force | 3,292 | 30,125 | 84,343 | |
Workforce Employed | 8,055 | 68,139 | 200,683 | |
Workforce Unemployed | 448 | 2,750 | 8,677 | |
Civlian Workforce | 8,503 | 70,890 | 209,360 | |
Military Workforce | 96 | 1,504 | 5,160 | |
Total Households | 4,145 | 42,016 | 129,629 | |
Family Households | 3,224 | 29,913 | 90,248 | |
Non-Family Households | 921 | 12,103 | 39,382 | |
Married Couple | 2,477 | 22,961 | 70,230 | |
Other Family | 746 | 6,953 | 20,018 | |
Married w/Child | 1,162 | 10,311 | 32,082 | |
Single Male w/Child | 26 | 852 | 2,257 | |
Single Female w/Child | 231 | 2,430 | 7,182 |
Population Change Last Two Decades - Plus Projection
2000 | % | 2010 | % | 2020 | % | 2030 | |
---|---|---|---|---|---|---|---|
District of Columbia | 572,059 | +5 | 601,723 | +21 | 729,501 | +15 | 842,154 |
Virginia | 7,078,515 | +13 | 8,001,024 | +8 | 8,655,021 | +8 | 9,331,666 |
Arlington County | 189,453 | +10 | 207,627 | +20 | 249,298 | +10 | 274,339 |
Fairfax County | 969,749 | +12 | 1,081,726 | +7 | 1,162,504 | +7 | 1,244,025 |
Prince William County | 280,813 | +43 | 402,002 | +19 | 478,134 | +20 | 571,844 |
Alexandria city | 128,283 | +9 | 139,966 | +19 | 166,261 | +10 | 182,067 |
Fairfax city | 21,498 | +5 | 22,565 | +11 | 25,047 | +5 | 26,397 |
Total Working Age Population:
Total Households:
Total Working Age Population:
Total Households:
Total Working Age Population:
Total Households: