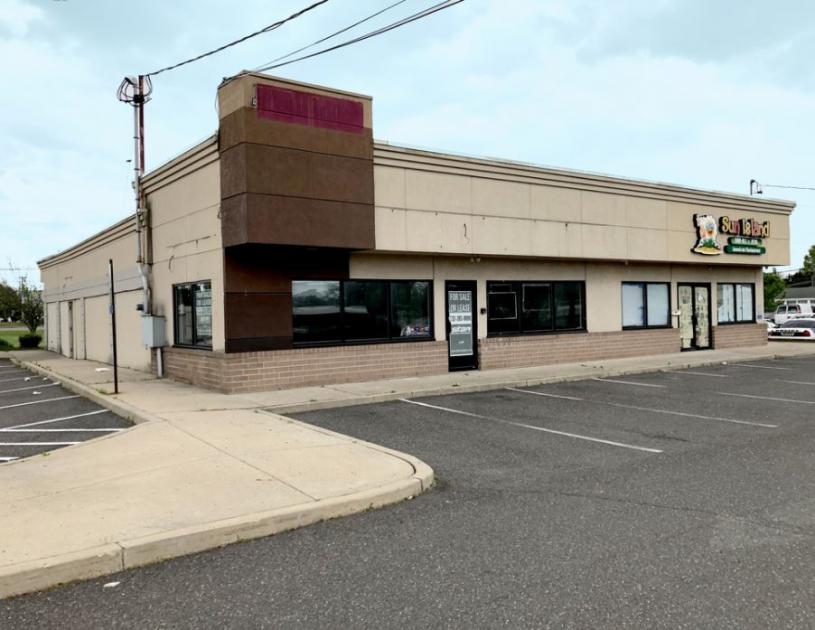
Retail Space
34 U.S. 130 Burlington, NJ 08016
34 U.S. 130 Burlington, NJ 08016
Details & Description
Property Highlights
- • Located next to Walgreens
- • One story building
- • Zoned retail
- • 30 parking spaces
- • Traffic count 37,504
- • Taxes $27,586.20 2020
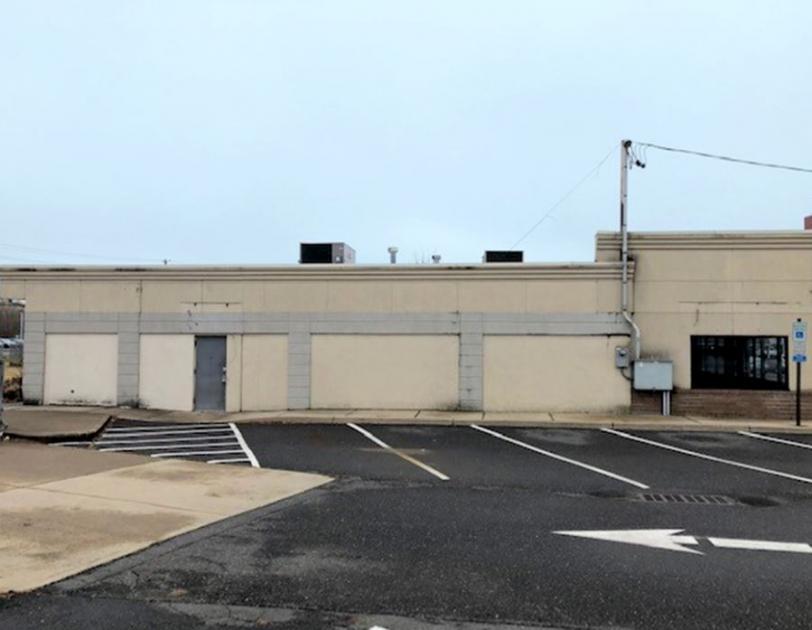
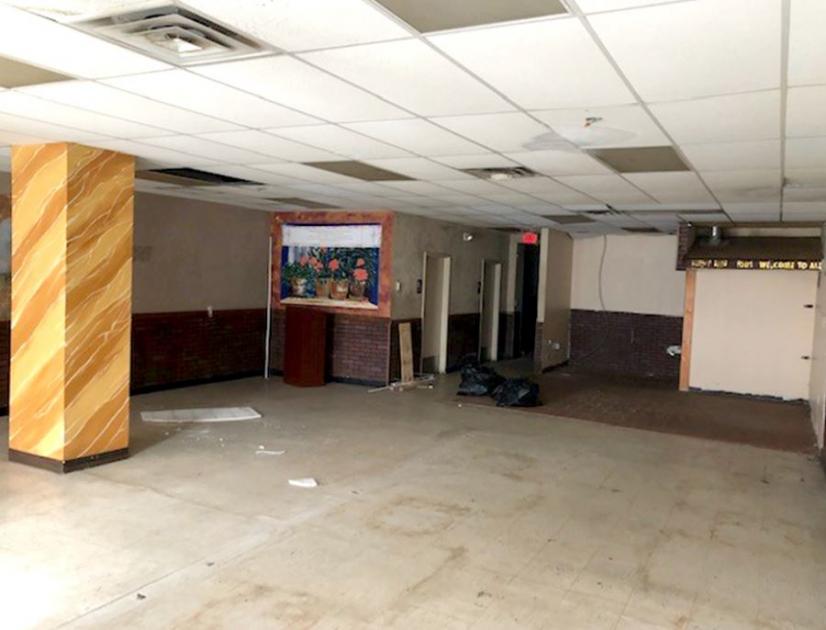
Additional Photos

Listing Agents

Leslie Wulach
O: 732-283-9000
M: 732-710-5492
wulach@sitarcompany.com
O: 732-283-9000
M: 732-710-5492
wulach@sitarcompany.com
While we strive to provide the most accurate information, all listing information, and demographic data, is provided by third-parties. As such, MyEListing will not be responsible for the accuracy of the information. It is strongly recommended that you verify all information with the listing agent, and any relevant agencies, prior to making any decisions.


