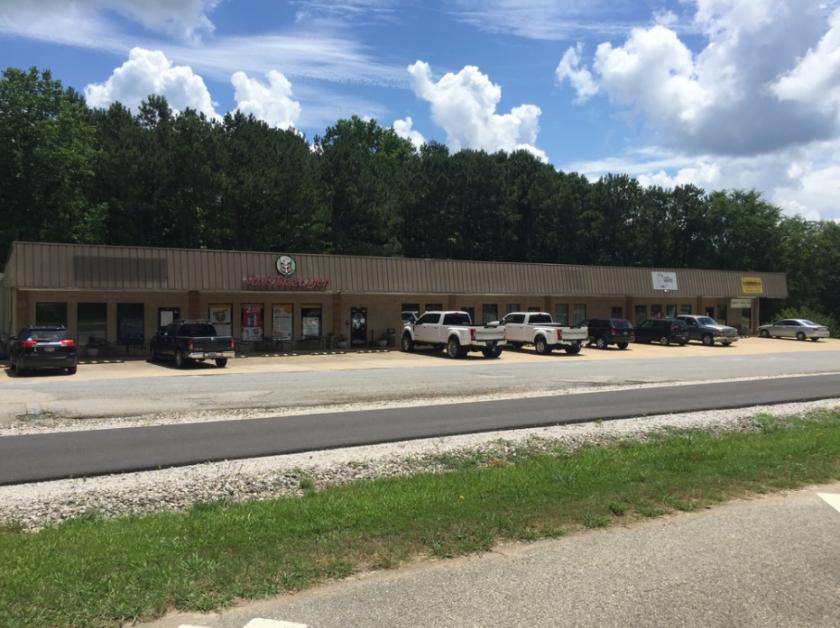
1-Mile | 3-Miles | 5-Miles | ||
---|---|---|---|---|
Total Population | 251 | 1,526 | 3,862 | |
Population Median Age | 36 | 40 | 40 | |
Population by Age | 0-9 Yrs | 41 (16%) | 199 (13%) | 449 (11%) |
10-19 Yrs | 19 (7%) | 131 (8%) | 422 (10%) | |
20-29 Yrs | 60 (23%) | 297 (19%) | 652 (16%) | |
30-39 Yrs | 35 (13%) | 191 (12%) | 459 (11%) | |
40-49 Yrs | 20 (7%) | 135 (8%) | 396 (10%) | |
50-59 Yrs | 26 (10%) | 171 (11%) | 447 (11%) | |
60-69 Yrs | 25 (9%) | 207 (13%) | 541 (14%) | |
70+ Yrs | 26 (10%) | 195 (12%) | 495 (12%) | |
Median HH Income | $38,312 | $44,650 | $49,446 | |
Total Household Income | < 24K | 30 (29%) | 161 (26%) | 358 (24%) |
25-49K | 30 (29%) | 174 (28%) | 382 (26%) | |
50-74K | 15 (14%) | 102 (16%) | 264 (18%) | |
75-99K | 10 (9%) | 62 (10%) | 168 (11%) | |
100-199K | 15 (14%) | 91 (14%) | 244 (16%) | |
200K+ | 2 (1%) | 20 (3%) | 48 (3%) | |
Highest Education Level | No Diploma | 26 | 154 | 373 |
Diploma or GED | 42 | 297 | 775 | |
Some College | 58 | 332 | 805 | |
Assoc. Degree | 12 | 73 | 190 | |
Bachelors Degree | 16 | 127 | 348 | |
Higher Degree | 9 | 80 | 226 | |
Total Housing Units | 136 | 789 | 1,809 | |
--Owner-Occupied | 47 | 369 | 1,009 | |
--Renter-Occupied | 55 | 241 | 455 | |
Owner-Occupied Values | < 100K | 14 | 110 | 308 |
100-199K | 21 | 147 | 376 | |
200-299K | 4 | 37 | 137 | |
300-399K | 1 | 16 | 51 | |
400-499K | 3 | 21 | 44 | |
500K+ | 4 | 38 | 94 | |
Total Working Age Population | 202 | 1,256 | 3,152 | |
In Work Force | 136 | 735 | 1,763 | |
Not In Work Force | 66 | 521 | 1,389 | |
Workforce Employed | 124 | 673 | 1,614 | |
Workforce Unemployed | 12 | 63 | 142 | |
Civlian Workforce | 136 | 735 | 1,756 | |
Military Workforce | 0 | 0 | 7 | |
Total Households | 102 | 610 | 1,464 | |
Family Households | 65 | 403 | 1,021 | |
Non-Family Households | 37 | 207 | 443 | |
Married Couple | 28 | 223 | 649 | |
Other Family | 37 | 180 | 372 | |
Married w/Child | 7 | 55 | 198 | |
Single Male w/Child | 4 | 18 | 40 | |
Single Female w/Child | 13 | 64 | 135 |
Population Change Last Two Decades - Plus Projection
2000 | % | 2010 | % | 2020 | % | 2030 | |
---|---|---|---|---|---|---|---|
Georgia | 8,186,453 | +18 | 9,687,653 | +12 | 10,833,472 | +13 | 12,292,423 |
Harris County | 23,695 | +35 | 32,024 | +8 | 34,712 | +8 | 37,327 |
Meriwether County | 22,534 | -2 | 21,992 | -4 | 21,020 | -1 | 20,895 |
Troup County | 58,779 | +14 | 67,044 | +5 | 70,414 | +3 | 72,836 |
Total Working Age Population:
Total Households:
Total Working Age Population:
Total Households:
Total Working Age Population:
Total Households: