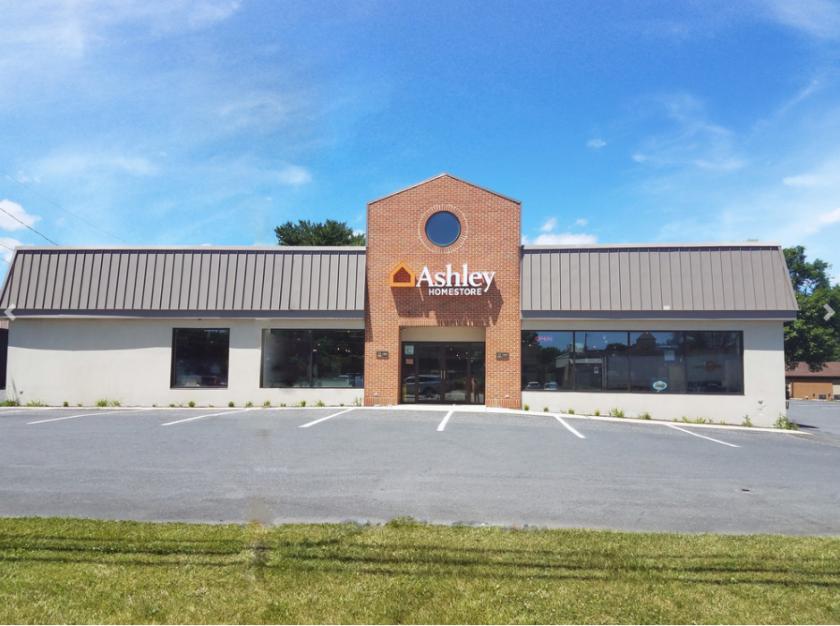
1-Mile | 3-Miles | 5-Miles | ||
---|---|---|---|---|
Total Population | 4,414 | 38,080 | 88,342 | |
Population Median Age | 37 | 40 | 42 | |
Population by Age | 0-9 Yrs | 782 (17%) | 5060 (13%) | 10693 (12%) |
10-19 Yrs | 496 (11%) | 4589 (12%) | 10250 (11%) | |
20-29 Yrs | 381 (8%) | 3657 (9%) | 8461 (9%) | |
30-39 Yrs | 688 (15%) | 5092 (13%) | 10762 (12%) | |
40-49 Yrs | 585 (13%) | 5385 (14%) | 12149 (13%) | |
50-59 Yrs | 612 (13%) | 5211 (13%) | 12344 (13%) | |
60-69 Yrs | 491 (11%) | 4661 (12%) | 11616 (13%) | |
70+ Yrs | 380 (8%) | 4425 (11%) | 12067 (13%) | |
Median HH Income | $104,268 | $85,559 | $81,114 | |
Total Household Income | < 24K | 74 (4%) | 1347 (8%) | 3856 (10%) |
25-49K | 273 (16%) | 2921 (18%) | 7301 (19%) | |
50-74K | 205 (12%) | 2483 (16%) | 6041 (16%) | |
75-99K | 233 (14%) | 2309 (14%) | 5490 (14%) | |
100-199K | 618 (37%) | 4657 (30%) | 10832 (29%) | |
200K+ | 260 (15%) | 1736 (11%) | 3563 (9%) | |
Highest Education Level | No Diploma | 93 | 1190 | 3235 |
Diploma or GED | 540 | 6455 | 16014 | |
Some College | 348 | 3928 | 9720 | |
Assoc. Degree | 287 | 2272 | 5415 | |
Bachelors Degree | 1025 | 8170 | 18312 | |
Higher Degree | 642 | 4695 | 10978 | |
Total Housing Units | 1,705 | 16,256 | 39,037 | |
--Owner-Occupied | 1,307 | 11,551 | 27,543 | |
--Renter-Occupied | 355 | 3,902 | 9,540 | |
Owner-Occupied Values | < 100K | 33 | 788 | 1817 |
100-199K | 299 | 3250 | 8930 | |
200-299K | 442 | 3798 | 8838 | |
300-399K | 238 | 1950 | 4064 | |
400-499K | 172 | 989 | 2170 | |
500K+ | 123 | 776 | 1723 | |
Total Working Age Population | 3,330 | 29,993 | 71,088 | |
In Work Force | 2,402 | 20,721 | 47,585 | |
Not In Work Force | 928 | 9,272 | 23,502 | |
Workforce Employed | 2,338 | 20,042 | 45,858 | |
Workforce Unemployed | 48 | 600 | 1,611 | |
Civlian Workforce | 2,386 | 20,642 | 47,468 | |
Military Workforce | 16 | 79 | 117 | |
Total Households | 1,662 | 15,453 | 37,082 | |
Family Households | 1,217 | 10,231 | 24,082 | |
Non-Family Households | 445 | 5,222 | 13,001 | |
Married Couple | 980 | 8,487 | 20,034 | |
Other Family | 237 | 1,743 | 4,048 | |
Married w/Child | 431 | 3,448 | 7,644 | |
Single Male w/Child | 77 | 302 | 642 | |
Single Female w/Child | 85 | 723 | 1,709 |
Population Change Last Two Decades - Plus Projection
2000 | % | 2010 | % | 2020 | % | 2030 | |
---|---|---|---|---|---|---|---|
Pennsylvania | 12,281,054 | +3 | 12,702,379 | +4 | 13,230,170 | +4 | 13,759,594 |
Cumberland County | 213,674 | +10 | 235,406 | +7 | 251,836 | +6 | 268,063 |
Dauphin County | 251,798 | +6 | 268,100 | +4 | 279,506 | +3 | 289,132 |
Juniata County | 22,821 | +8 | 24,636 | 0 | 24,681 | +1 | 25,013 |
Perry County | 43,602 | +5 | 45,969 | +6 | 48,597 | +4 | 50,348 |
York County | 381,751 | +14 | 434,972 | +6 | 460,514 | +5 | 484,497 |
Total Working Age Population:
Total Households:
Total Working Age Population:
Total Households:
Total Working Age Population:
Total Households: