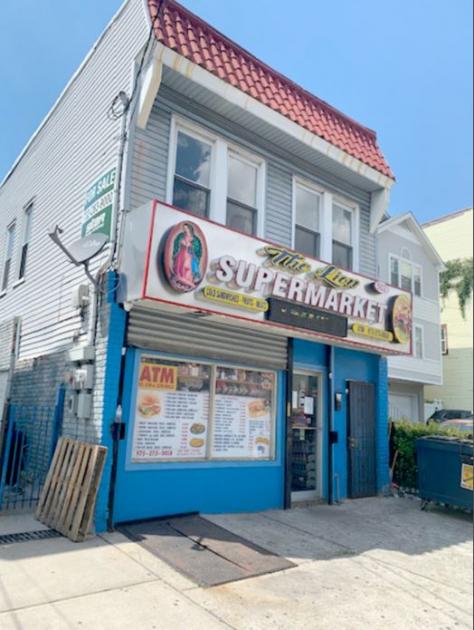
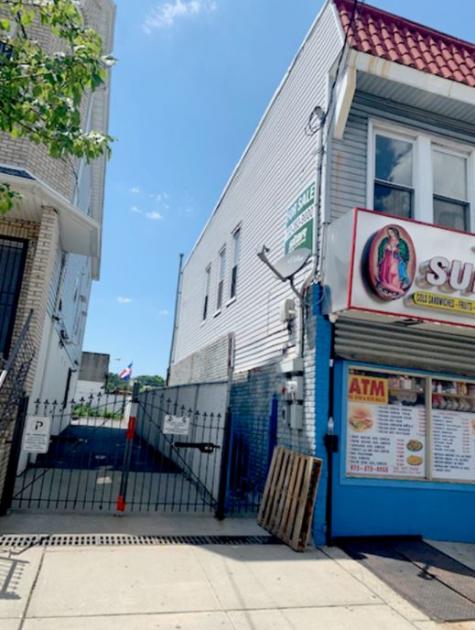
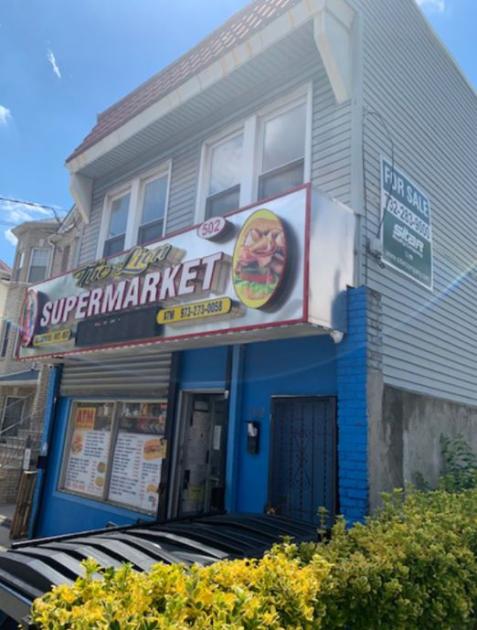
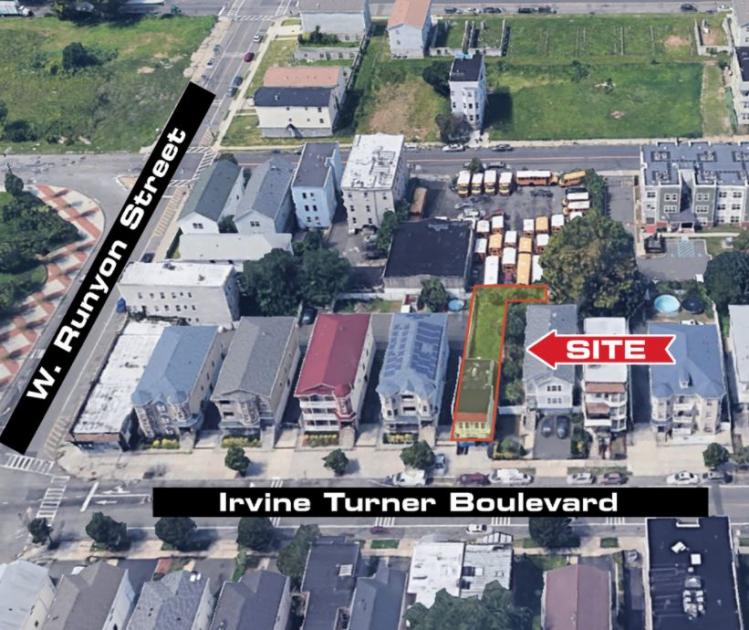
1-Mile | 3-Miles | 5-Miles | ||
---|---|---|---|---|
Total Population | 38,823 | 336,584 | 814,584 | |
Population Median Age | 34 | 36 | 37 | |
Population by Age | 0-9 Yrs | 6088 (15%) | 46416 (13%) | 110521 (13%) |
10-19 Yrs | 5964 (15%) | 44598 (13%) | 105860 (12%) | |
20-29 Yrs | 5696 (14%) | 53429 (15%) | 122060 (14%) | |
30-39 Yrs | 5833 (15%) | 50967 (15%) | 119495 (14%) | |
40-49 Yrs | 5007 (12%) | 46324 (13%) | 109436 (13%) | |
50-59 Yrs | 4359 (11%) | 40809 (12%) | 103933 (12%) | |
60-69 Yrs | 3113 (8%) | 29910 (8%) | 77759 (9%) | |
70+ Yrs | 2762 (7%) | 24129 (7%) | 65521 (8%) | |
Median HH Income | $30,426 | $41,823 | $50,423 | |
Total Household Income | < 24K | 6440 (42%) | 38288 (31%) | 77980 (27%) |
25-49K | 4196 (27%) | 29874 (24%) | 64759 (22%) | |
50-74K | 2033 (13%) | 20192 (16%) | 48089 (16%) | |
75-99K | 1036 (6%) | 12668 (10%) | 31540 (10%) | |
100-199K | 1210 (8%) | 16502 (13%) | 49804 (17%) | |
200K+ | 163 (1%) | 3136 (2%) | 15115 (5%) | |
Highest Education Level | No Diploma | 4930 | 45572 | 103472 |
Diploma or GED | 9182 | 78438 | 180559 | |
Some College | 5471 | 43508 | 98807 | |
Assoc. Degree | 1358 | 13076 | 30948 | |
Bachelors Degree | 2546 | 27504 | 82536 | |
Higher Degree | 691 | 13150 | 43939 | |
Total Housing Units | 18,236 | 138,981 | 320,376 | |
--Owner-Occupied | 2,829 | 32,111 | 95,308 | |
--Renter-Occupied | 12,249 | 88,549 | 191,979 | |
Owner-Occupied Values | < 100K | 193 | 2546 | 5772 |
100-199K | 994 | 9285 | 16524 | |
200-299K | 764 | 10992 | 28272 | |
300-399K | 524 | 5478 | 24601 | |
400-499K | 217 | 1956 | 9513 | |
500K+ | 138 | 1854 | 10626 | |
Total Working Age Population | 28,744 | 263,300 | 640,171 | |
In Work Force | 17,489 | 170,886 | 417,421 | |
Not In Work Force | 11,255 | 92,414 | 222,750 | |
Workforce Employed | 14,863 | 151,853 | 381,181 | |
Workforce Unemployed | 2,627 | 18,842 | 35,777 | |
Civlian Workforce | 17,489 | 170,696 | 416,959 | |
Military Workforce | 0 | 190 | 462 | |
Total Households | 15,078 | 120,661 | 287,286 | |
Family Households | 8,675 | 73,952 | 183,283 | |
Non-Family Households | 6,403 | 46,709 | 104,004 | |
Married Couple | 2,936 | 34,676 | 99,189 | |
Other Family | 5,738 | 39,275 | 84,094 | |
Married w/Child | 1,281 | 15,821 | 45,210 | |
Single Male w/Child | 679 | 4,190 | 9,277 | |
Single Female w/Child | 2,913 | 16,536 | 34,291 |
Population Change Last Two Decades - Plus Projection
2000 | % | 2010 | % | 2020 | % | 2030 | |
---|---|---|---|---|---|---|---|
New Jersey | 8,414,350 | +4 | 8,791,894 | +4 | 9,132,700 | +4 | 9,530,900 |
Bergen County | 884,118 | +2 | 905,116 | +7 | 967,500 | +7 | 1,031,500 |
Essex County | 793,633 | -1 | 783,969 | +3 | 808,300 | +3 | 829,800 |
Hudson County | 608,975 | +4 | 634,266 | +12 | 708,100 | +6 | 747,400 |
Morris County | 470,212 | +5 | 492,276 | +3 | 509,100 | +5 | 535,600 |
Union County | 522,541 | +3 | 536,499 | +7 | 573,000 | +6 | 605,600 |
New York | 18,976,457 | +2 | 19,378,102 | +4 | 20,146,131 | +2 | 20,604,030 |
Richmond County | 443,728 | +6 | 468,730 | +3 | 481,351 | +1 | 488,119 |
Total Working Age Population:
Total Households:
Total Working Age Population:
Total Households:
Total Working Age Population:
Total Households: