Retail Space
1102 South Market Street Mechanicsburg, PA 17055
1102 South Market Street Mechanicsburg, PA 17055
Details & Description
Property Highlights
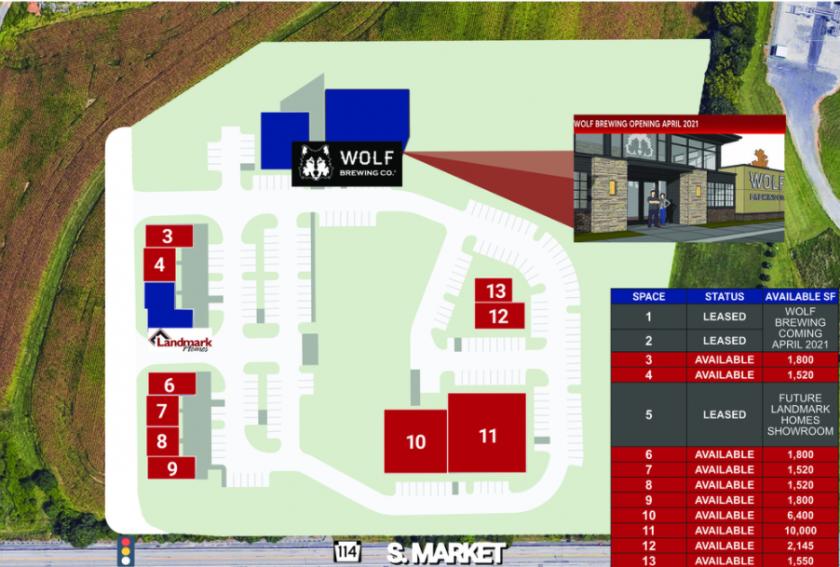
• Outstanding traffic counts, exposure, and proximity to complementary retailers
• 20-minute drive time demographic of 420,000 people with yearly HHI of $80,000
Listing Agents

Justin Shoemaker
O: 717-731-1990
justin@landmarkcr.com
O: 717-731-1990
justin@landmarkcr.com

Sean Fitzsimmons
O: 717-731-1990
M: 717-421-6031
sfitzsimmons@landmarkcr.com
O: 717-731-1990
M: 717-421-6031
sfitzsimmons@landmarkcr.com
While we strive to provide the most accurate information, all listing information, and demographic data, is provided by third-parties. As such, MyEListing will not be responsible for the accuracy of the information. It is strongly recommended that you verify all information with the listing agent, and any relevant agencies, prior to making any decisions.