Industrial Properties
711 Gibson Boulevard Harrisburg, PA 17104
711 Gibson Boulevard Harrisburg, PA 17104
Details & Description
Property Highlights
- • Hard to find trailer parking - 20-25 trailers
- • - 75 employee parking spaces
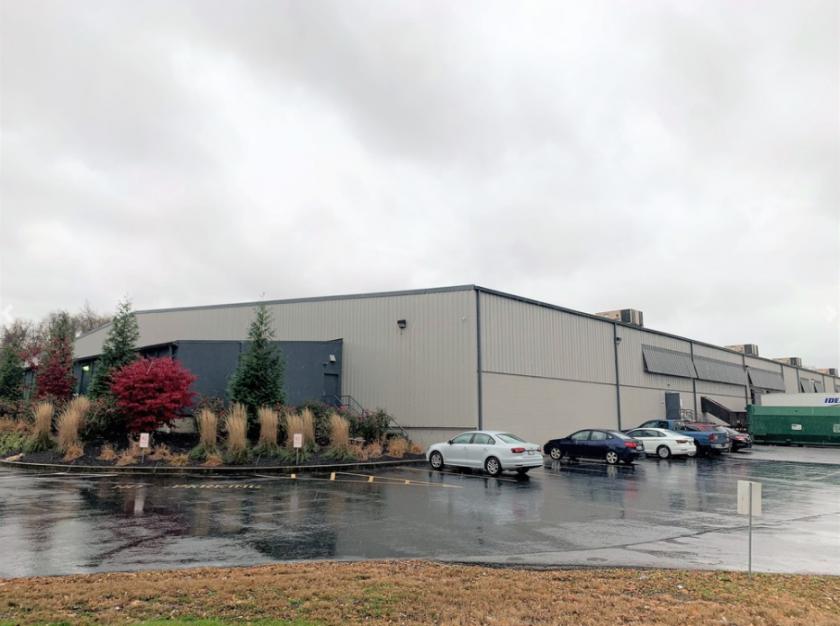
- • Site is fully fenced and secured
Listing Agents

Jason Grace
O: 717-731-1990
M: 717-421-1943
jgrace@landmarkcr.com
O: 717-731-1990
M: 717-421-1943
jgrace@landmarkcr.com
While we strive to provide the most accurate information, all listing information, and demographic data, is provided by third-parties. As such, MyEListing will not be responsible for the accuracy of the information. It is strongly recommended that you verify all information with the listing agent, and any relevant agencies, prior to making any decisions.