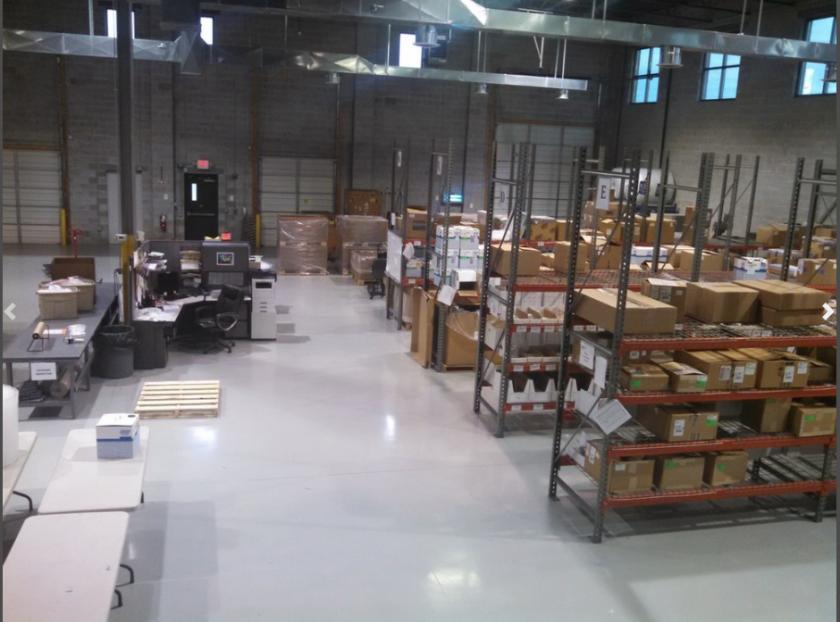
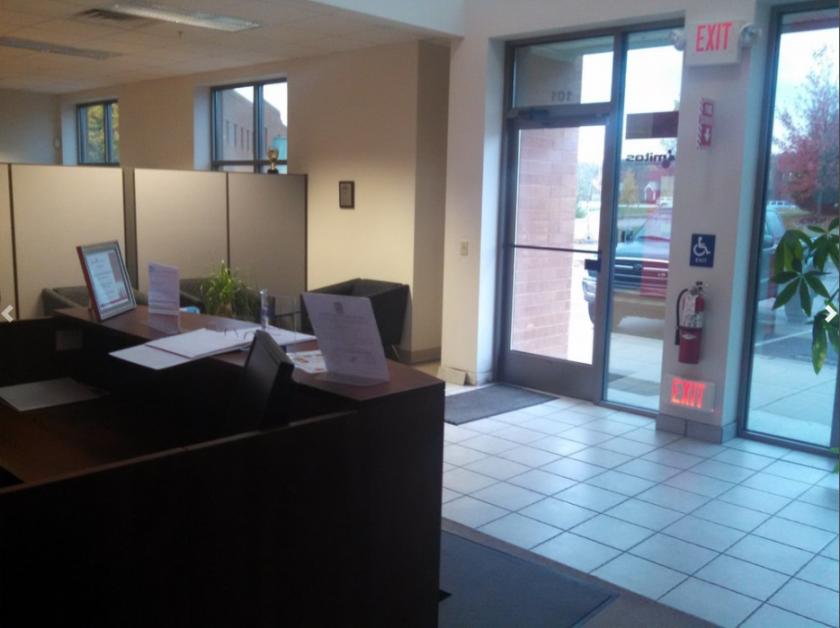
Flex-Office-Warehouse
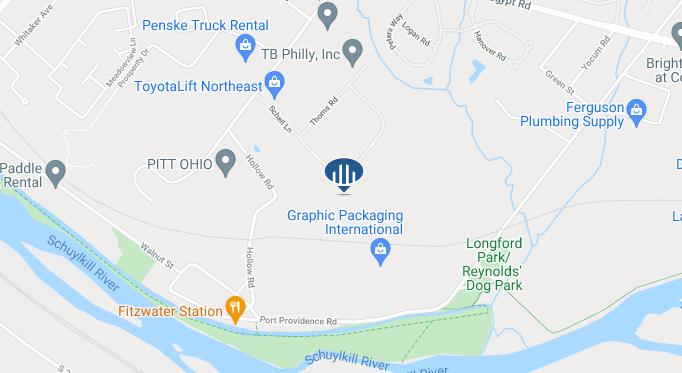
700 Schell Lane Phoenixville, PA 19460
700 Schell Lane Phoenixville, PA 19460
Details & Description
Property Highlights
- • Built in 2007
- • Zoned Industrial
- • T-5 Lighting throughout
- • 24 clear ceiling height
- • 2 Tailgate doors, 1 Drive in
- • 100 sprinkler
Listing Agents

Jason Grace
O: 717-731-1990
M: 717-421-1943
jgrace@landmarkcr.com
O: 717-731-1990
M: 717-421-1943
jgrace@landmarkcr.com
While we strive to provide the most accurate information, all listing information, and demographic data, is provided by third-parties. As such, MyEListing will not be responsible for the accuracy of the information. It is strongly recommended that you verify all information with the listing agent, and any relevant agencies, prior to making any decisions.