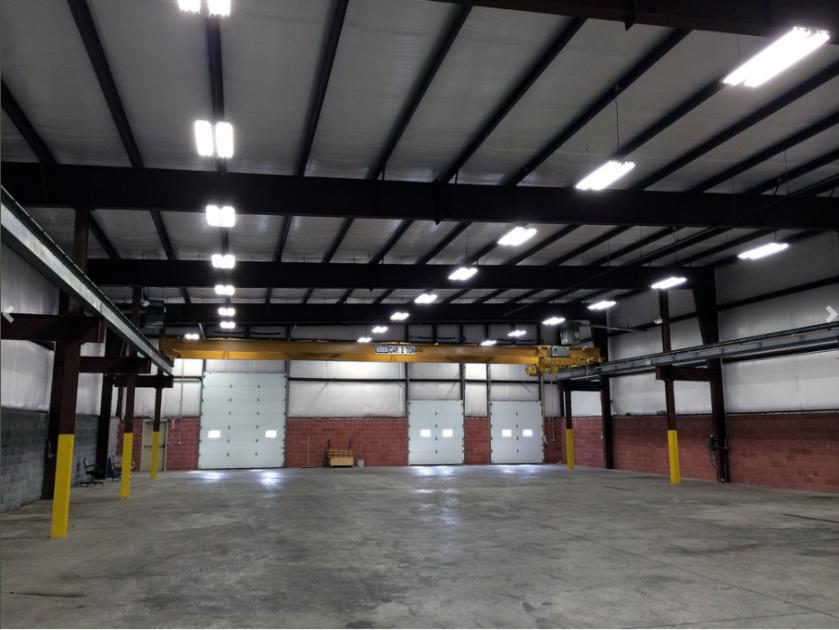
Flex-Office-Warehouse
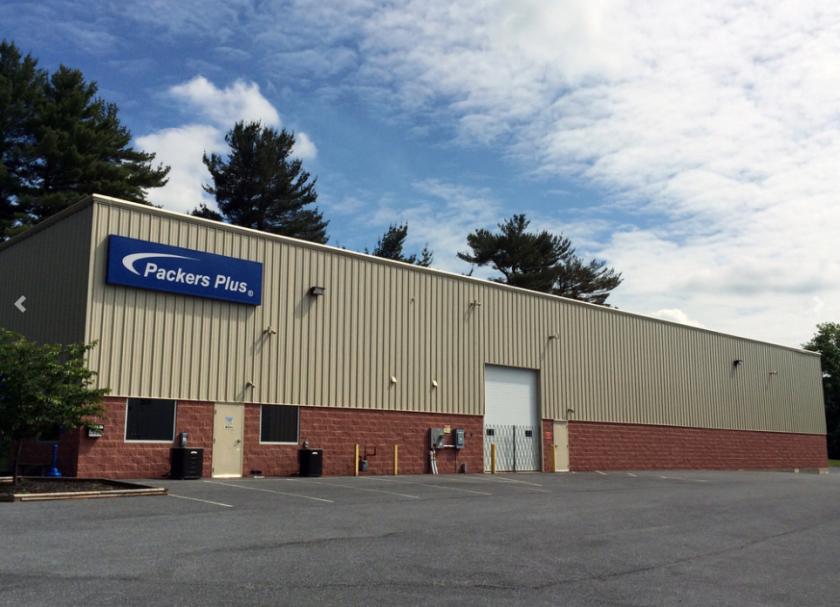
3605b Hartzdale Drive Camp Hill, PA 17011
3605b Hartzdale Drive Camp Hill, PA 17011
Details & Description
Property Highlights
- • Expandable
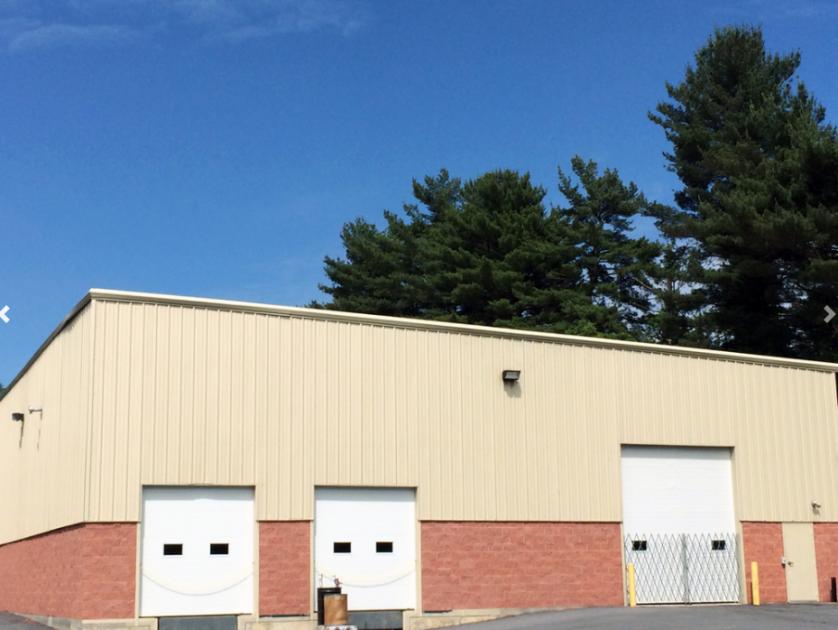
- • Loading dock doors can be added on west side
- • Exterior docks 9 X 10
- • Signage available
- • Property is adjacent to Norfolk Southern rail line
- • Copy of zoning on file
Listing Agents

Jason Grace
O: 717-731-1990
M: 717-421-1943
jgrace@landmarkcr.com
O: 717-731-1990
M: 717-421-1943
jgrace@landmarkcr.com
While we strive to provide the most accurate information, all listing information, and demographic data, is provided by third-parties. As such, MyEListing will not be responsible for the accuracy of the information. It is strongly recommended that you verify all information with the listing agent, and any relevant agencies, prior to making any decisions.