Office Space
340 North Avenue East Cranford, NJ 07016
340 North Avenue East Cranford, NJ 07016
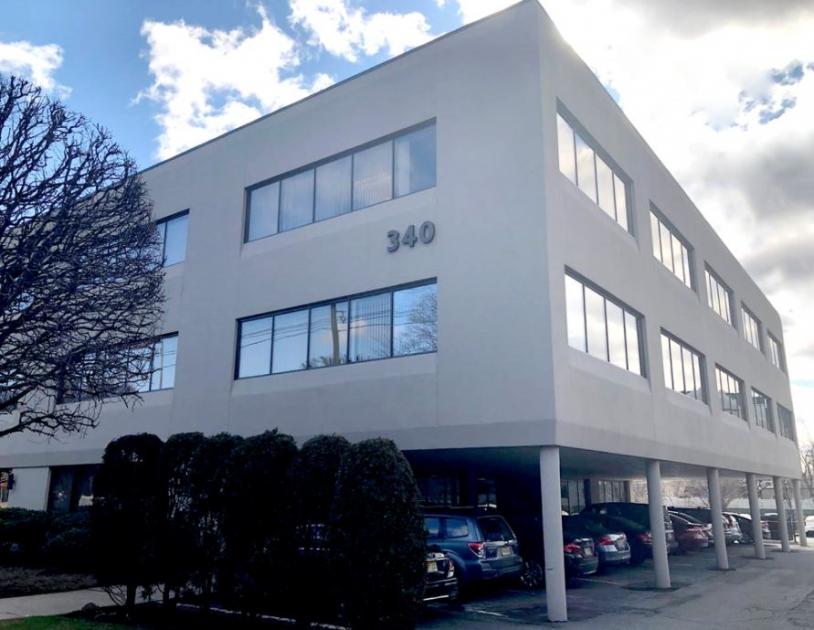
Details & Description
Property Highlights
- • Constructed in 1984
- • Well maintained
- • 41 parking ratio
- • Minutes to downtown Cranford
- • Taxes $134,455.44 2020
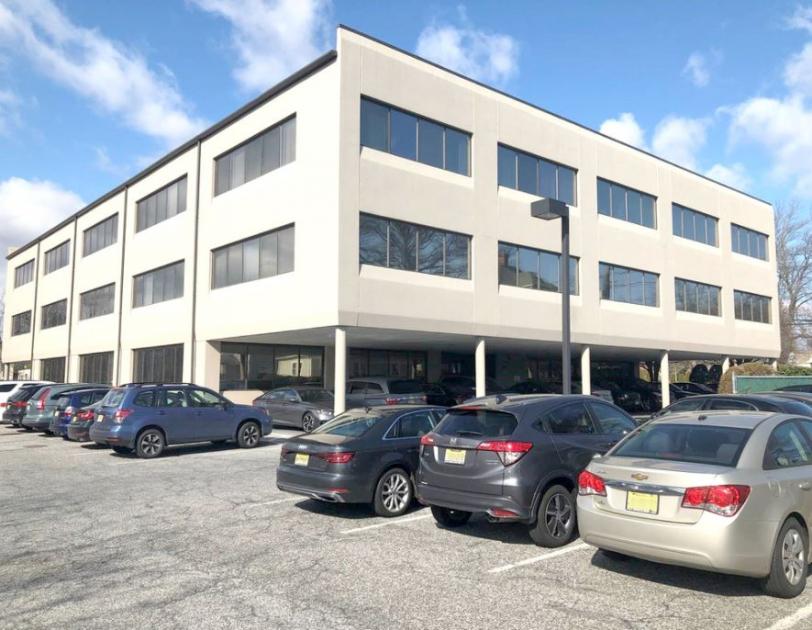
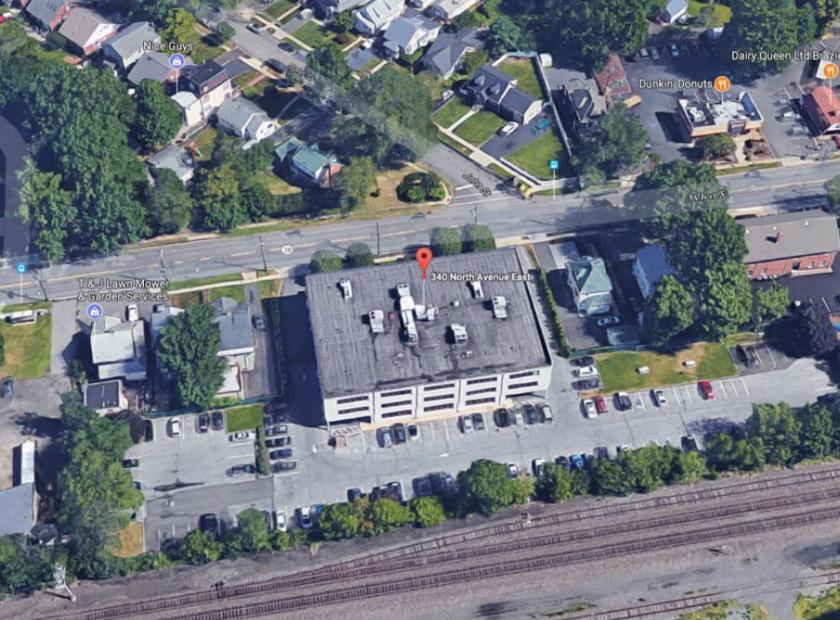
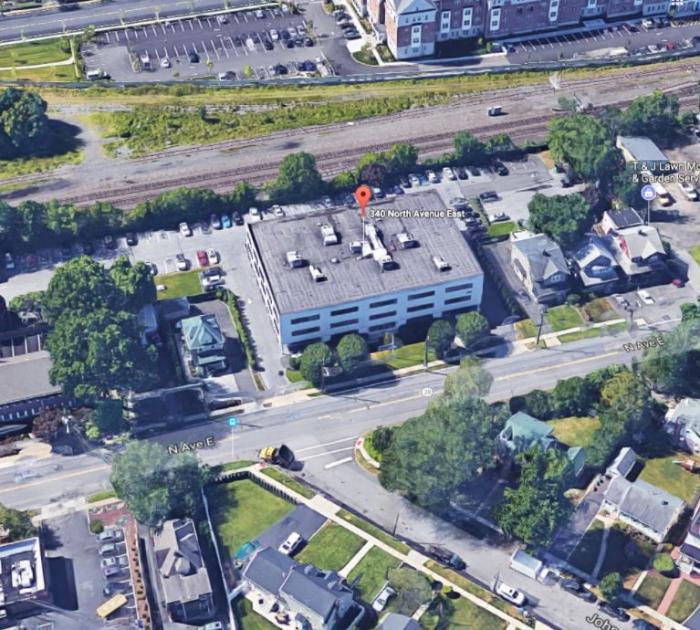
Additional Photos
Listing Agents

Douglas Sitar
O: 732-283-9000
M: 732-859-2144
dsitar@sitarcompany.com
O: 732-283-9000
M: 732-859-2144
dsitar@sitarcompany.com
While we strive to provide the most accurate information, all listing information, and demographic data, is provided by third-parties. As such, MyEListing will not be responsible for the accuracy of the information. It is strongly recommended that you verify all information with the listing agent, and any relevant agencies, prior to making any decisions.


