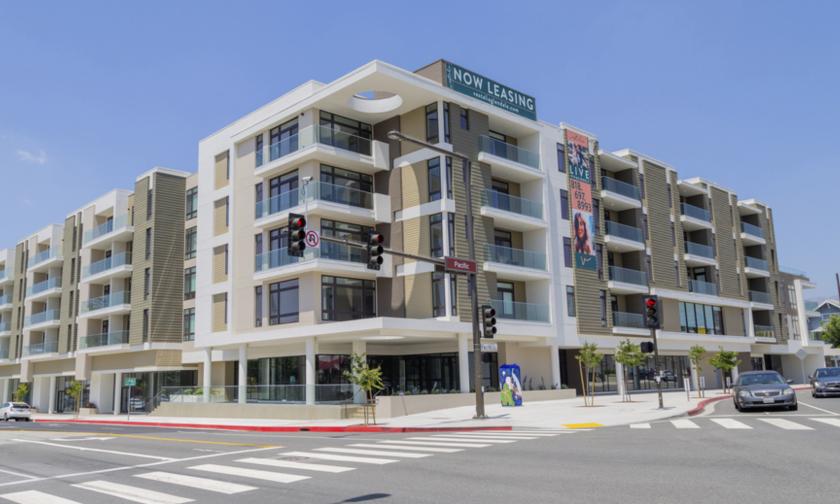
Highly visible, ground floor restaurant/retail space in a newly completed mixed-use property located at the signalized corner of Broadway and Pacific Avenue; available suite sizes are very flexible; grease interceptor in place; large patio and sidewalk provide an outstanding opportunity for outside dining or display; HVAC supplied (but not distributed) to the various suites; excellent parking ratio of 5.72/1,000 SF (with additional spaces available in tandem); the electrical infrastructure in the parking garage allows ownership to install a large number of electric car charging stations if so desired; easy access to the grade-level parking for the commercial spaces from Broadway and Pacific Avenue; built-in clientele with 180 apartments above the commercial space; two blocks from Glendale Galleria and The Americana at Brand; excellent vehicular traffic with 21,704 cars per day (southbound) and 14,219 cars per day (eastbound) at the corner of Broadway and Pacific per the City of Glendale; close proximity to the 5 & 134 FreewaysDISCLAIMER: All information provided herein together with any projections or other data has been furnished from sources which we deem reliable, but for which we assume no liability, expressed or implied. Interested parties are to conduct independent investigation and verification of all information including but not limited to condition of the property, compliance or lack of compliance with applicable governmental requirements, development potential or suitability, financial performance of the property, projected financial performance of the property, any party’s intended use or any and all other matters.