Industrial Properties
196 U.S. 9 Englishtown, NJ 07726
196 U.S. 9 Englishtown, NJ 07726
Details & Description
Property Highlights
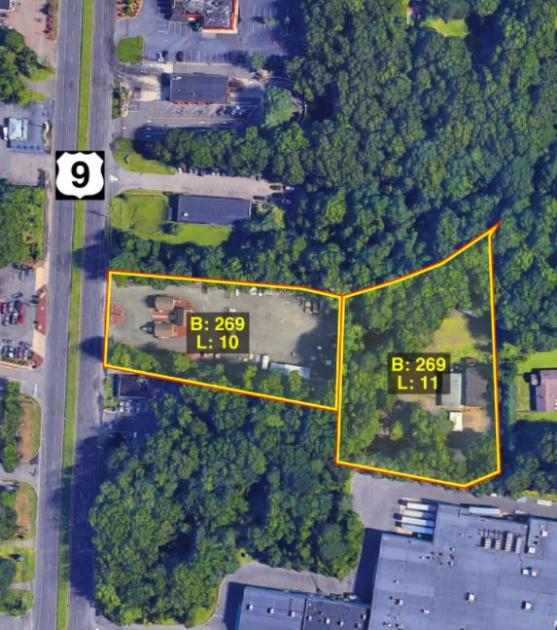
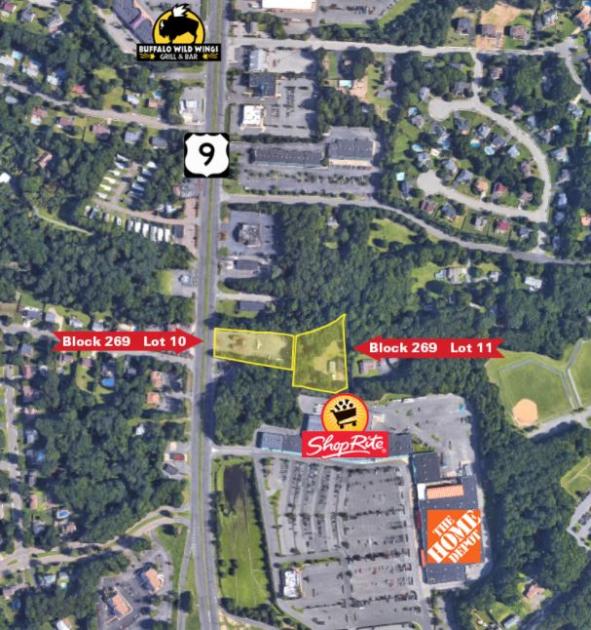
- • Pylon signage on highly traveled Route 9
- • Great exposure with a traffic count of 63,000 VPD
- • Across the street from Whole Foods
- • Taxes $32,535.02 2018
Additional Photos

Listing Agents

Justin Goodman
O: 732-449-2000
goodman@sitarcompany.com
O: 732-449-2000
goodman@sitarcompany.com
While we strive to provide the most accurate information, all listing information, and demographic data, is provided by third-parties. As such, MyEListing will not be responsible for the accuracy of the information. It is strongly recommended that you verify all information with the listing agent, and any relevant agencies, prior to making any decisions.


