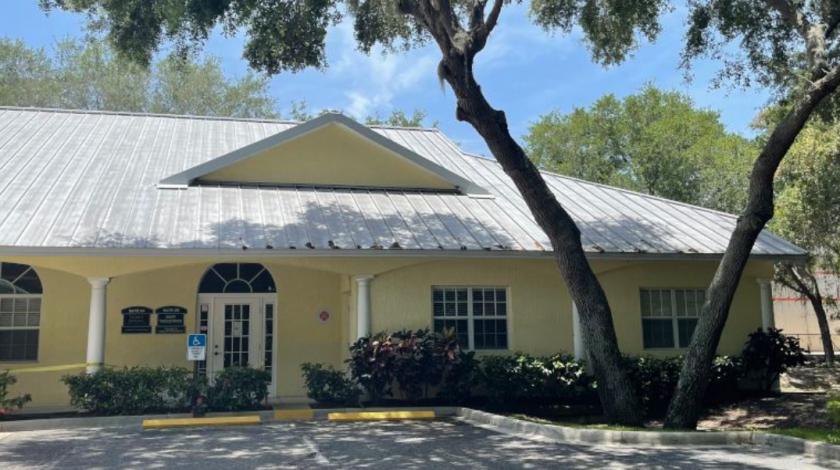
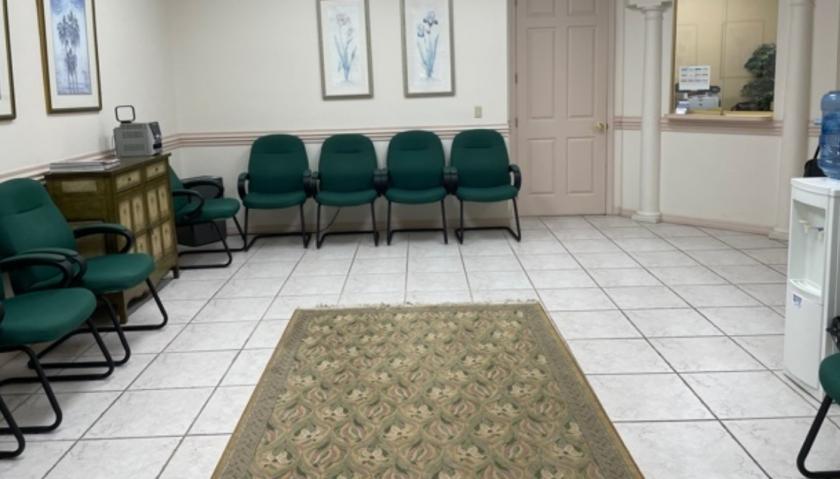
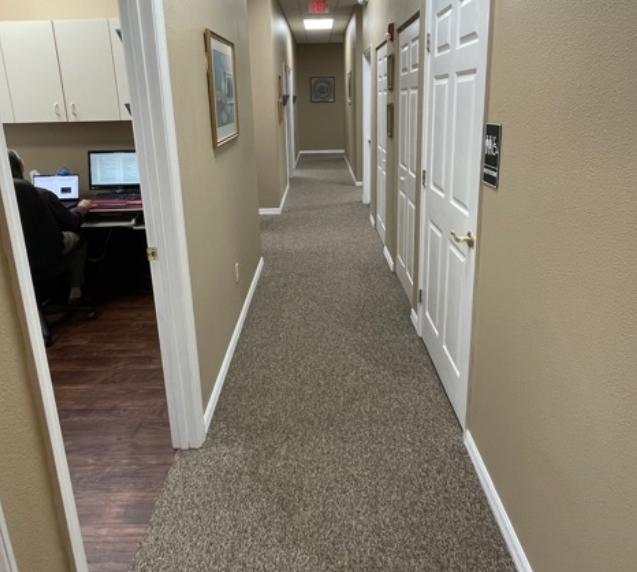
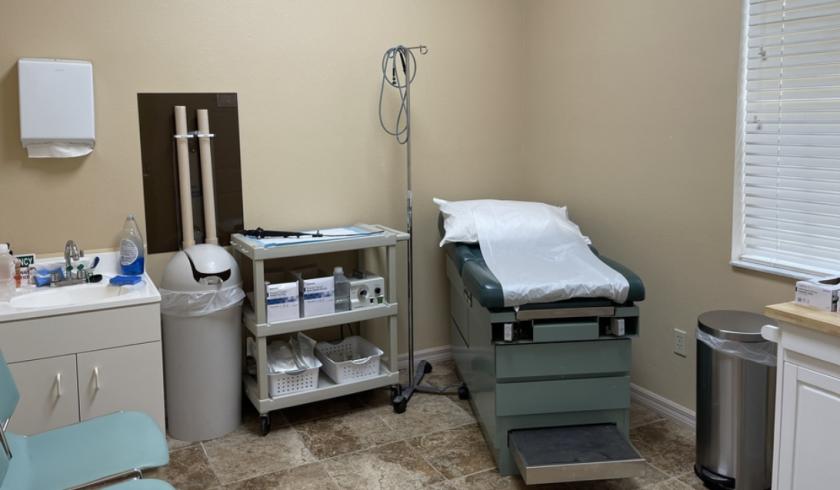
1-Mile | 3-Miles | 5-Miles | ||
---|---|---|---|---|
Total Population | 6,037 | 45,913 | 83,808 | |
Population Median Age | 52 | 56 | 58 | |
Population by Age | 0-9 Yrs | 344 (5%) | 2249 (4%) | 3471 (4%) |
10-19 Yrs | 540 (8%) | 3186 (6%) | 5117 (6%) | |
20-29 Yrs | 543 (8%) | 2768 (6%) | 4626 (5%) | |
30-39 Yrs | 326 (5%) | 2669 (5%) | 3990 (4%) | |
40-49 Yrs | 575 (9%) | 3674 (8%) | 6050 (7%) | |
50-59 Yrs | 787 (13%) | 5701 (12%) | 9921 (11%) | |
60-69 Yrs | 1119 (18%) | 9591 (20%) | 19662 (23%) | |
70+ Yrs | 1803 (29%) | 16075 (35%) | 30971 (36%) | |
Median HH Income | $60,890 | $60,906 | $62,605 | |
Total Household Income | < 24K | 413 (15%) | 3528 (16%) | 6832 (16%) |
25-49K | 691 (25%) | 5244 (24%) | 9486 (23%) | |
50-74K | 669 (24%) | 4387 (20%) | 7735 (18%) | |
75-99K | 263 (9%) | 2708 (12%) | 5046 (12%) | |
100-199K | 618 (22%) | 4410 (20%) | 8844 (21%) | |
200K+ | 83 (3%) | 1311 (6%) | 2820 (6%) | |
Highest Education Level | No Diploma | 196 | 1849 | 3259 |
Diploma or GED | 1424 | 11676 | 20774 | |
Some College | 1090 | 8391 | 14895 | |
Assoc. Degree | 510 | 3735 | 6870 | |
Bachelors Degree | 1048 | 8148 | 16135 | |
Higher Degree | 661 | 5369 | 10891 | |
Total Housing Units | 3,150 | 28,031 | 54,523 | |
--Owner-Occupied | 2,115 | 18,121 | 33,792 | |
--Renter-Occupied | 621 | 3,467 | 6,970 | |
Owner-Occupied Values | < 100K | 148 | 1294 | 3163 |
100-199K | 610 | 5612 | 8349 | |
200-299K | 817 | 6148 | 9802 | |
300-399K | 400 | 3029 | 6114 | |
400-499K | 87 | 1200 | 3111 | |
500K+ | 52 | 837 | 3254 | |
Total Working Age Population | 5,400 | 41,748 | 77,378 | |
In Work Force | 2,669 | 17,175 | 28,938 | |
Not In Work Force | 2,731 | 24,572 | 48,440 | |
Workforce Employed | 2,563 | 16,230 | 27,441 | |
Workforce Unemployed | 106 | 945 | 1,497 | |
Civlian Workforce | 2,669 | 17,175 | 28,938 | |
Military Workforce | 0 | 0 | 0 | |
Total Households | 2,736 | 21,588 | 40,762 | |
Family Households | 1,697 | 13,785 | 25,351 | |
Non-Family Households | 1,039 | 7,803 | 15,411 | |
Married Couple | 1,429 | 11,882 | 22,341 | |
Other Family | 268 | 1,903 | 3,011 | |
Married w/Child | 236 | 1,621 | 2,543 | |
Single Male w/Child | 17 | 144 | 218 | |
Single Female w/Child | 91 | 473 | 701 |
Population Change Last Two Decades - Plus Projection
2000 | % | 2010 | % | 2020 | % | 2030 | |
---|---|---|---|---|---|---|---|
Florida | 15,982,378 | +18 | 18,801,310 | +14 | 21,517,610 | +13 | 24,340,457 |
Charlotte County | 141,627 | +13 | 159,978 | +15 | 183,728 | +12 | 206,145 |
Sarasota County | 325,957 | +16 | 379,448 | +14 | 431,147 | +12 | 484,314 |
Total Working Age Population:
Total Households:
Total Working Age Population:
Total Households:
Total Working Age Population:
Total Households: