Retail Space
3605 Old Airport Road Allentown, PA 18109
3605 Old Airport Road Allentown, PA 18109

Details & Description
Property Highlights
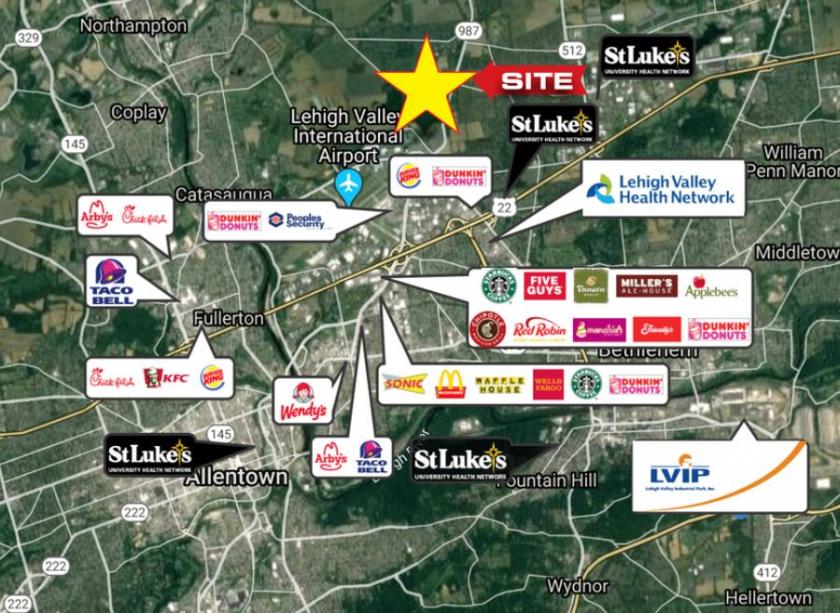
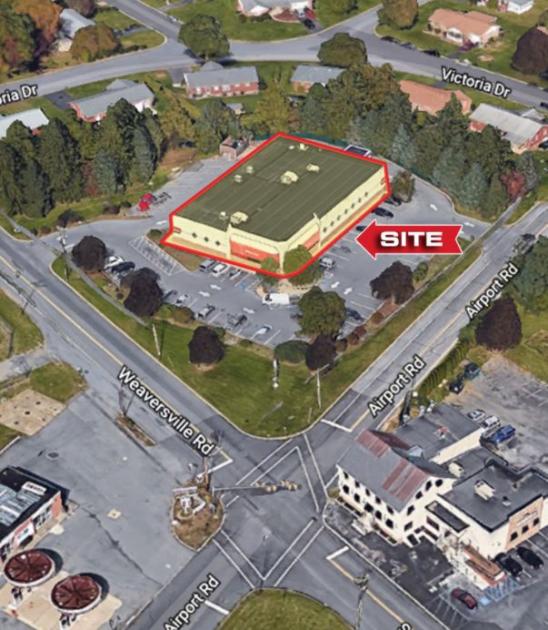
• Located at a signalized intersection of Airport, Weaversville and Schoenersville Roads
• Great location for retail, urgent care, medical offices, and many other uses
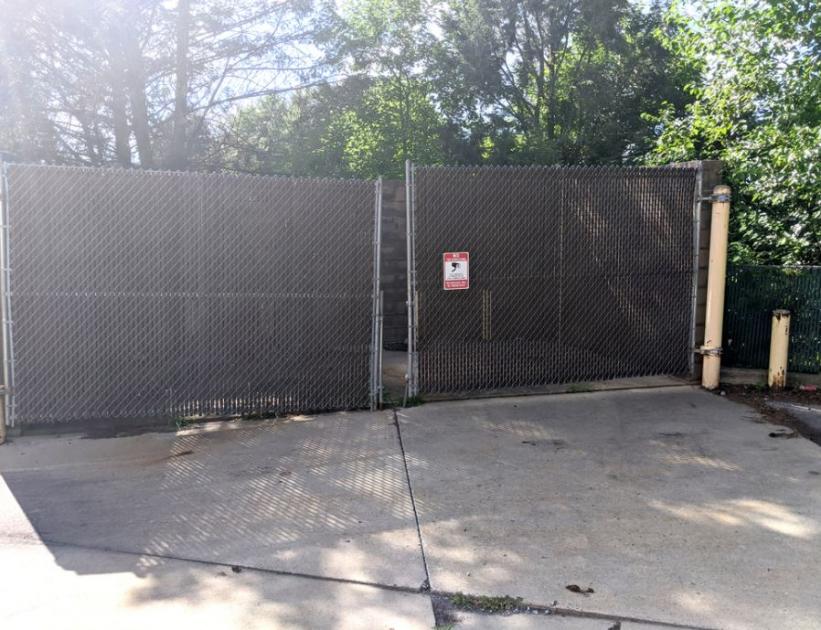
Additional Photos
Listing Agents

Giorgio Vasillis
O: 732-449-2000
M: 732-579-7002
vasilis@sitarcompany.com
O: 732-449-2000
M: 732-579-7002
vasilis@sitarcompany.com
While we strive to provide the most accurate information, all listing information, and demographic data, is provided by third-parties. As such, MyEListing will not be responsible for the accuracy of the information. It is strongly recommended that you verify all information with the listing agent, and any relevant agencies, prior to making any decisions.


