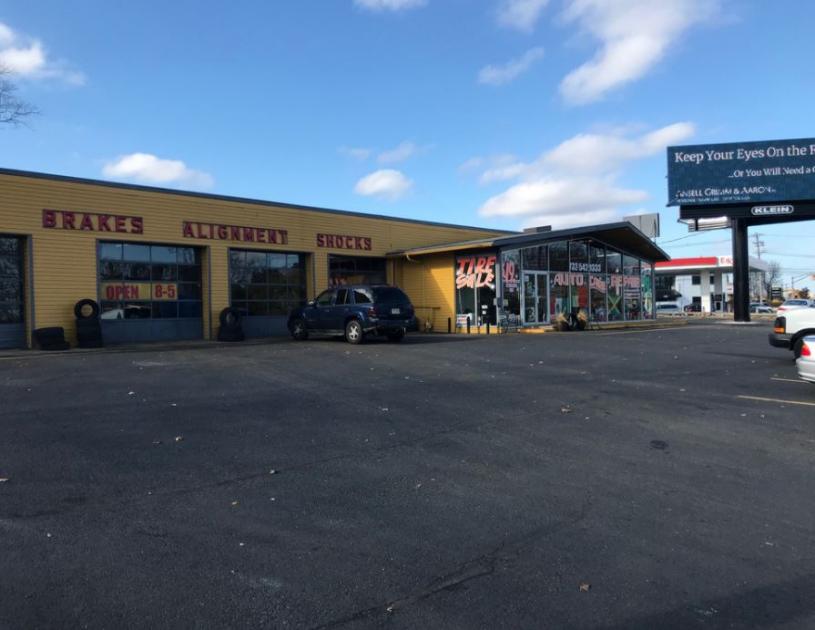
Retail Space
160 New Jersey 35 Eatontown, NJ 07724
160 New Jersey 35 Eatontown, NJ 07724
Details & Description
Property Highlights
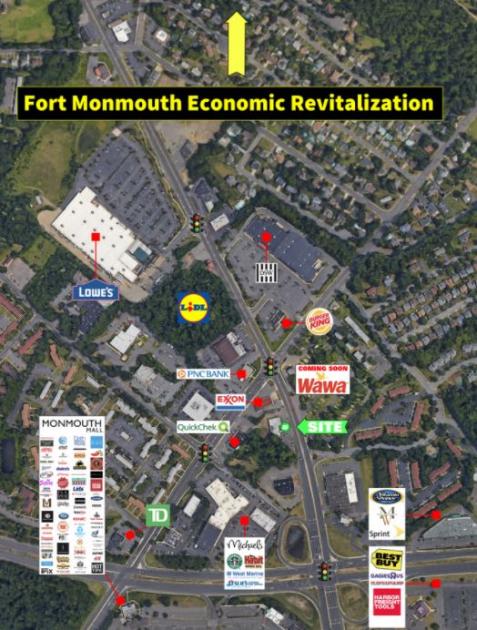
• Very high traffic counts of 43,504 2015 and 30,799 2014 just south and north of the site, respectively
• Across from Monmouth Mall
Listing Agents

Giorgio Vasillis
O: 732-449-2000
M: 732-579-7002
vasilis@sitarcompany.com
O: 732-449-2000
M: 732-579-7002
vasilis@sitarcompany.com
While we strive to provide the most accurate information, all listing information, and demographic data, is provided by third-parties. As such, MyEListing will not be responsible for the accuracy of the information. It is strongly recommended that you verify all information with the listing agent, and any relevant agencies, prior to making any decisions.