Retail Space
1450 Clements Bridge Road Woodbury, NJ 08096
1450 Clements Bridge Road Woodbury, NJ 08096
Details & Description
Property Highlights
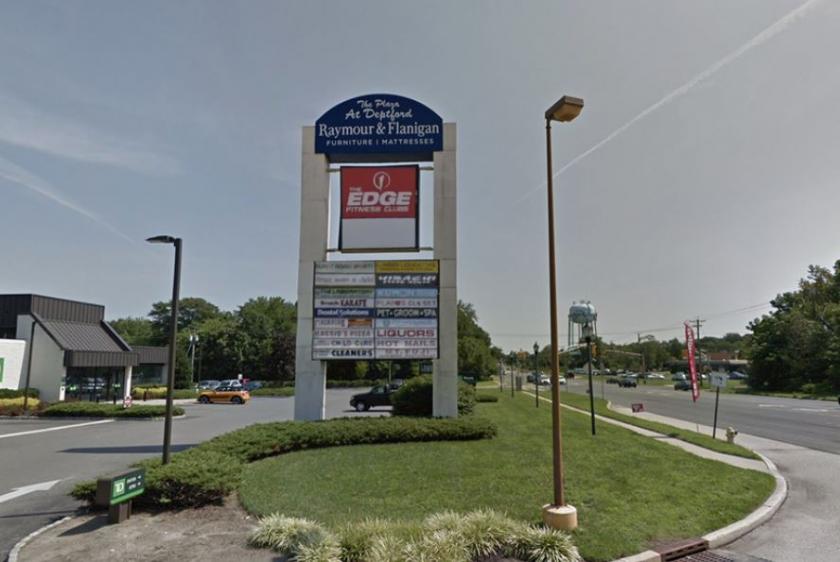
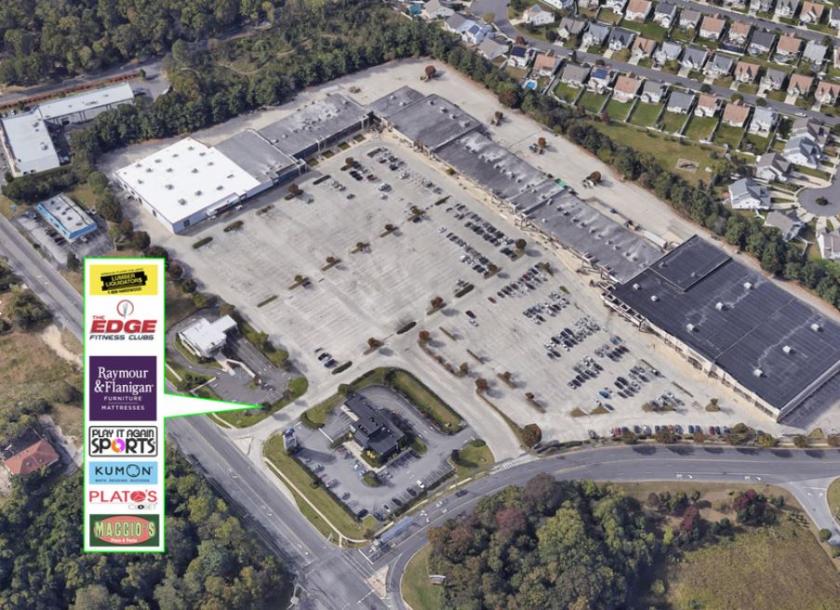
• Major Co-Tenants include TD Bank, Columbia Bank, Raymour and Flanigan, The Edge Fitness Club, Lumber Liquidators, Kumon
• Directly across the street from the new Super WaWa and Inspira developments
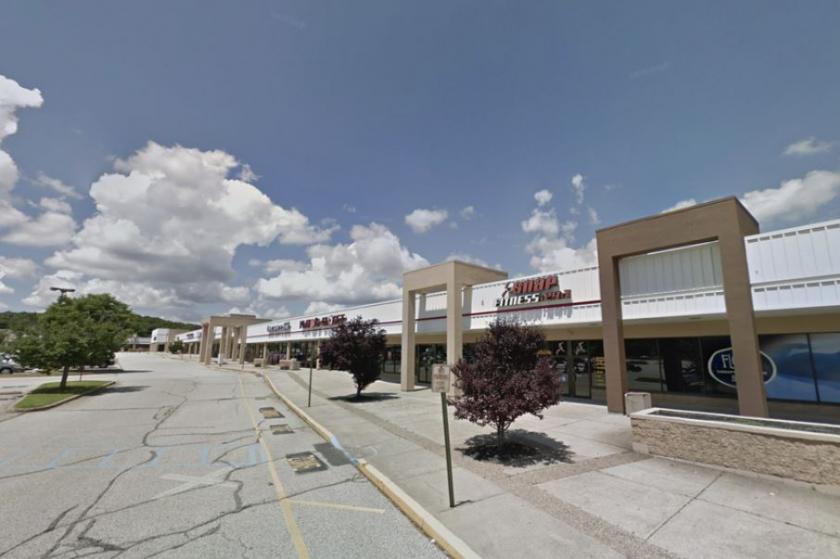
Additional Photos

Listing Agents

Giorgio Vasillis
O: 732-449-2000
M: 732-579-7002
vasilis@sitarcompany.com
O: 732-449-2000
M: 732-579-7002
vasilis@sitarcompany.com
While we strive to provide the most accurate information, all listing information, and demographic data, is provided by third-parties. As such, MyEListing will not be responsible for the accuracy of the information. It is strongly recommended that you verify all information with the listing agent, and any relevant agencies, prior to making any decisions.


