Office Space
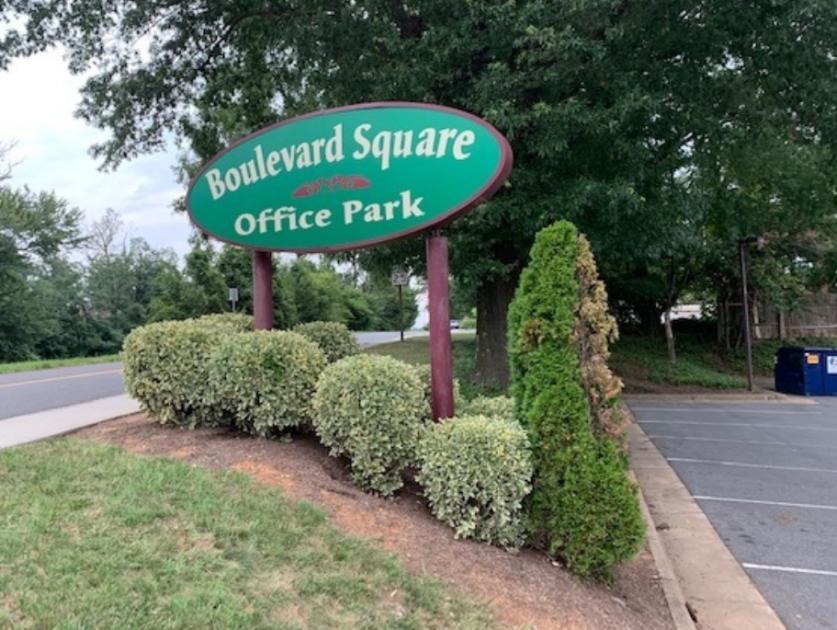
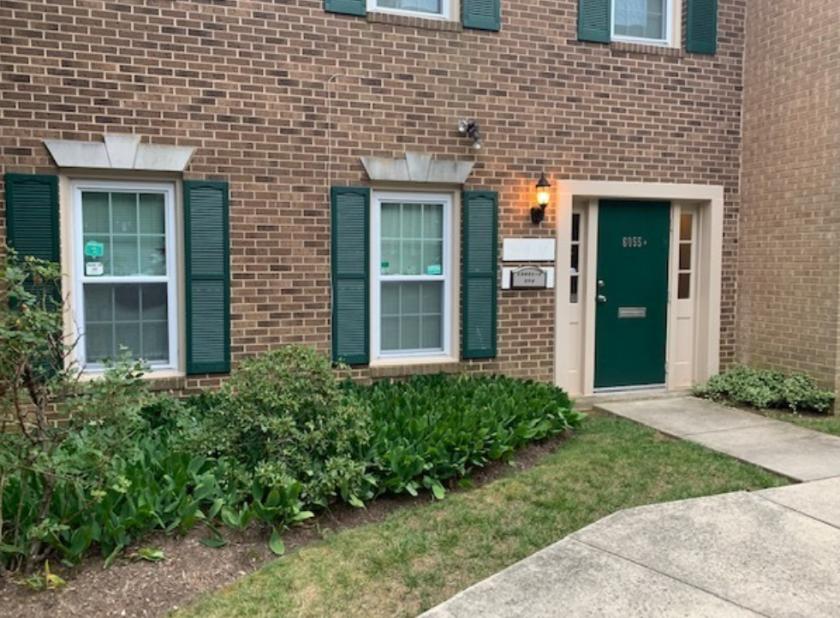
6055 Arlington Boulevard Falls Church, VA 22044
6055 Arlington Boulevard Falls Church, VA 22044
Details & Description
Property Highlights
- • Move in today... Sublease until April 20, 2022
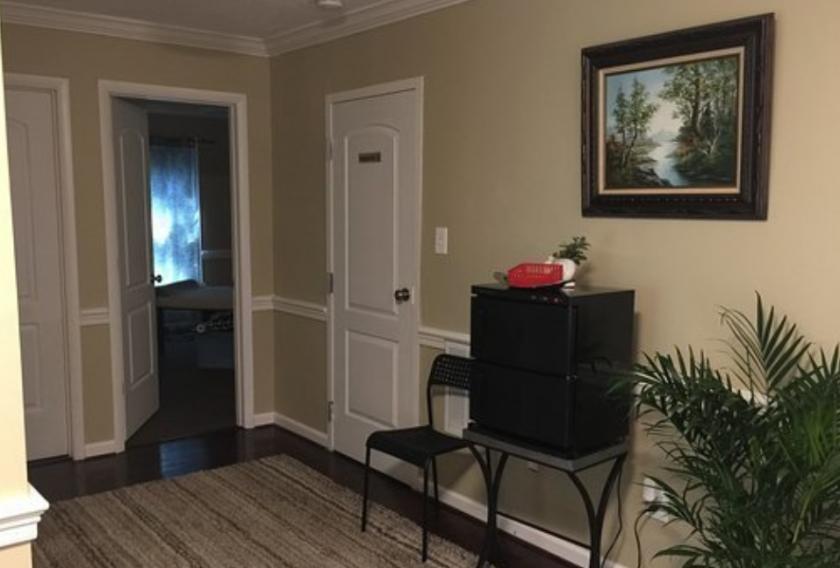
- • Three offices, bathroom and kitchen
- • Ample free parking
- • Handicap accessible
- • Near Arlington County line on Route 50
Listing Agents

Frank Dillow
O: 703-447-4161
M: 703-506-2850
francis.dillow@longandfoster.com
O: 703-447-4161
M: 703-506-2850
francis.dillow@longandfoster.com
While we strive to provide the most accurate information, all listing information, and demographic data, is provided by third-parties. As such, MyEListing will not be responsible for the accuracy of the information. It is strongly recommended that you verify all information with the listing agent, and any relevant agencies, prior to making any decisions.