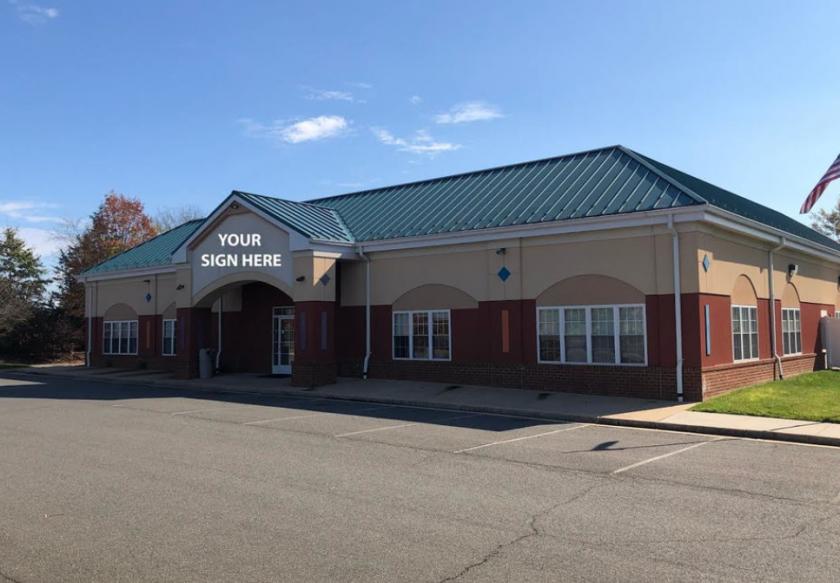
Specialty Real Estate
6223 Patrick Henry Boulevard Bealeton, VA 22712
6223 Patrick Henry Boulevard Bealeton, VA 22712
Details & Description
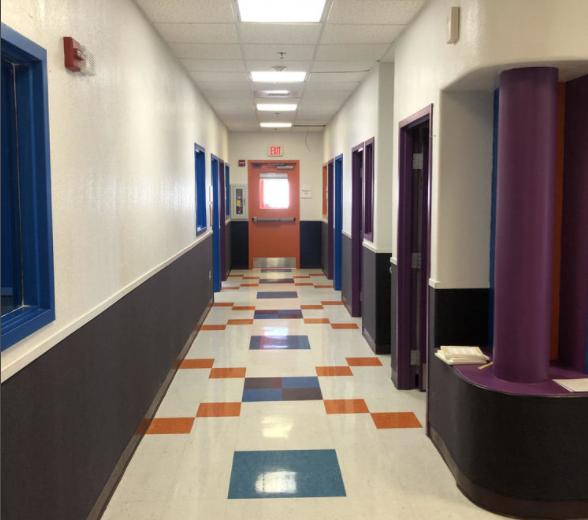
Property Highlights
- • Freestanding daycare building for sale or lease
- • Possibility to obtain FFE
- • Around 40 free surface parking spaces.
Listing Agents

Erik Ulsaker
O: 703-506-2850
M: 703-861-0373
eu@lnf.com
O: 703-506-2850
M: 703-861-0373
eu@lnf.com
While we strive to provide the most accurate information, all listing information, and demographic data, is provided by third-parties. As such, MyEListing will not be responsible for the accuracy of the information. It is strongly recommended that you verify all information with the listing agent, and any relevant agencies, prior to making any decisions.