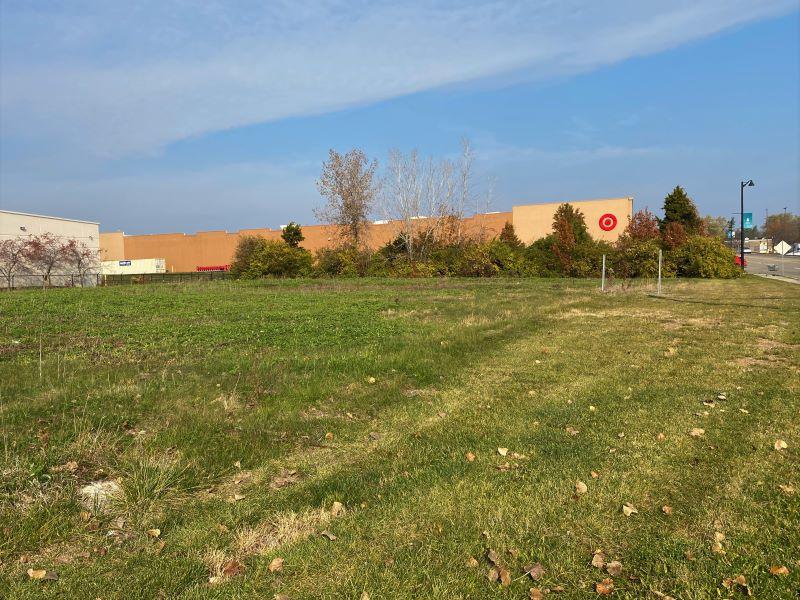
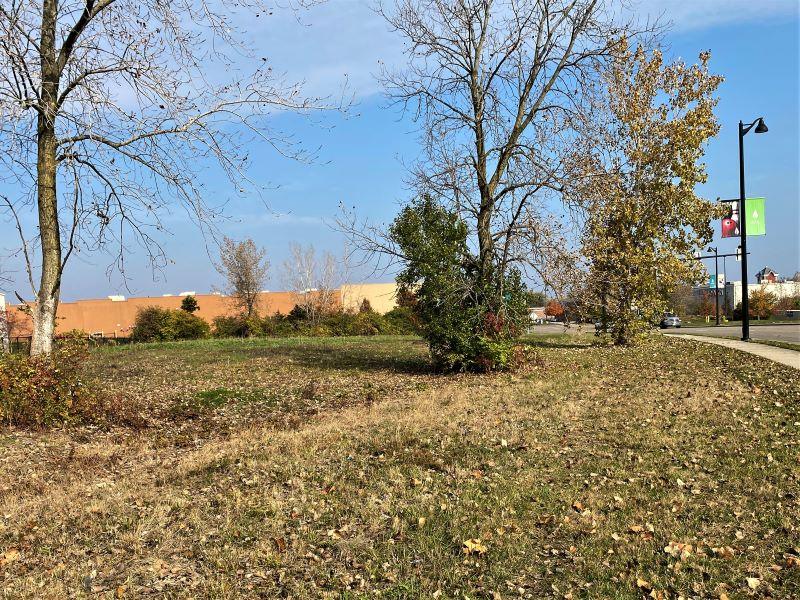
Commercial Land
1 Kingsridge Dr Dayton, OH 45459
1 Kingsridge Dr Dayton, OH 45459
Details & Description
Property Highlights
- • Zoned General Commercial
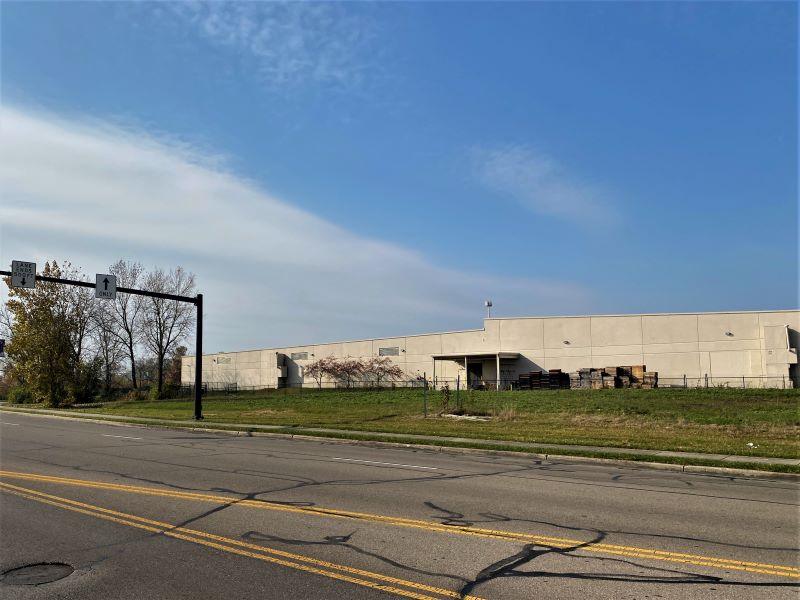
- • Additional traffic lights recently added.
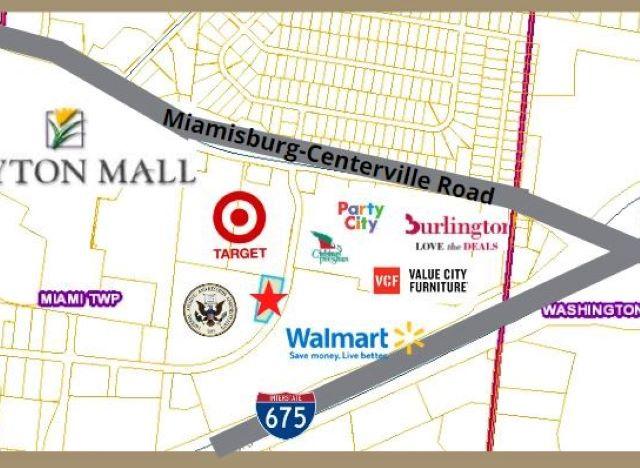
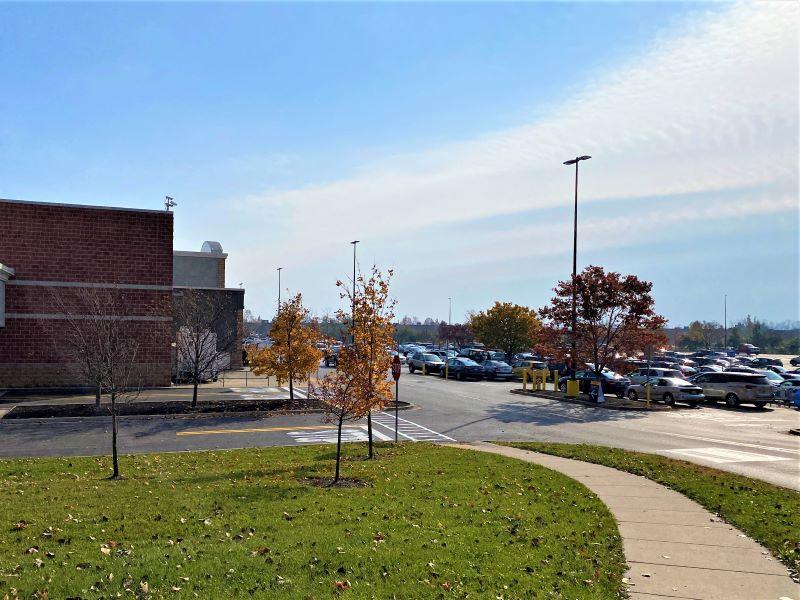
- • Across from 200,000 SF Super Walmart.
- • Parcel located in high traffic Dayton Mall area.
- • Visible from I-675, nearly 500 feet of frontage.
Additional Photos

Listing Agents

Timothy Albro
O: 937-222-1600
M: 937-609-8071
talbro@crestrealtyohio.com
O: 937-222-1600
M: 937-609-8071
talbro@crestrealtyohio.com
While we strive to provide the most accurate information, all listing information, and demographic data, is provided by third-parties. As such, MyEListing will not be responsible for the accuracy of the information. It is strongly recommended that you verify all information with the listing agent, and any relevant agencies, prior to making any decisions.