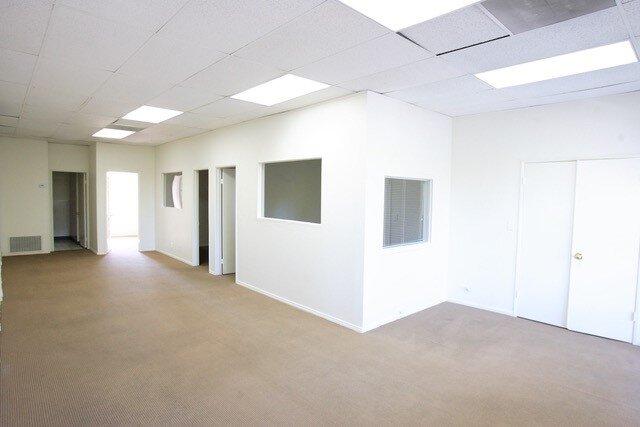
Office Space
171 East Thousand Oaks Boulevard Thousand Oaks, CA 91360
171 East Thousand Oaks Boulevard Thousand Oaks, CA 91360
Details & Description
Property Highlights
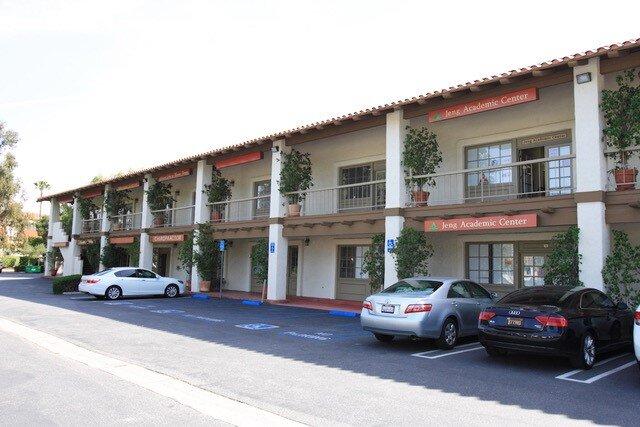
- • Dedicated Building Signage Available.
- • Space Ranging from 1,000 - 9,397 S.F.
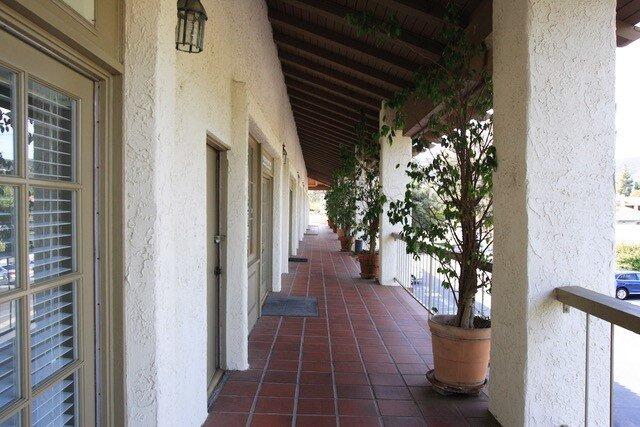
- • Exterior entrance with no common area hallways.
- • Abundant parking 41000.
Listing Agents

Aaron Guerrero
O: 805-497-4557
aaron@westcord.com
O: 805-497-4557
aaron@westcord.com
While we strive to provide the most accurate information, all listing information, and demographic data, is provided by third-parties. As such, MyEListing will not be responsible for the accuracy of the information. It is strongly recommended that you verify all information with the listing agent, and any relevant agencies, prior to making any decisions.