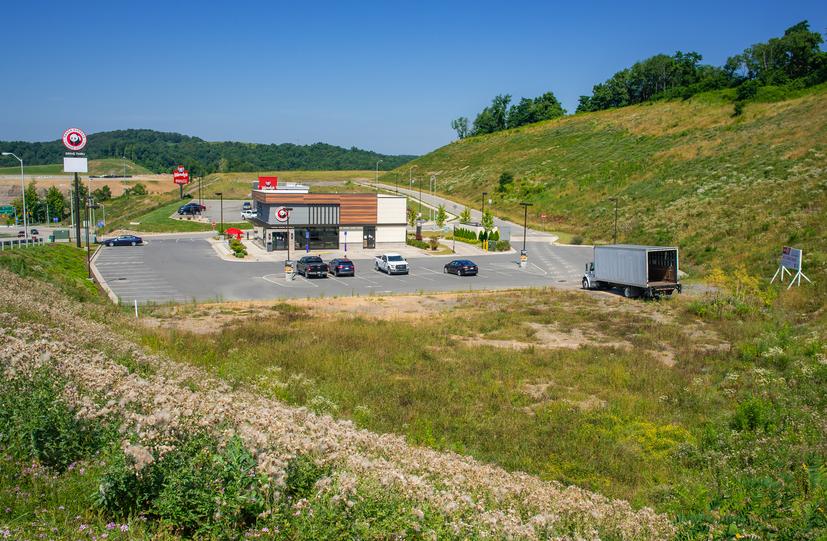
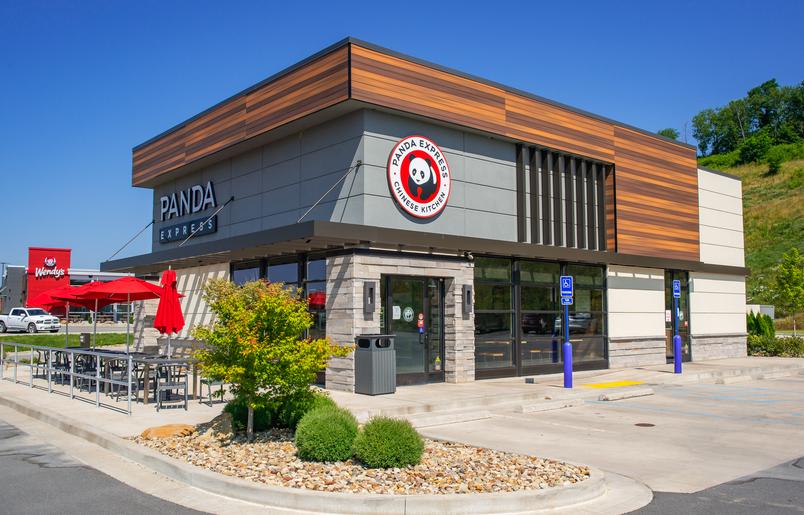
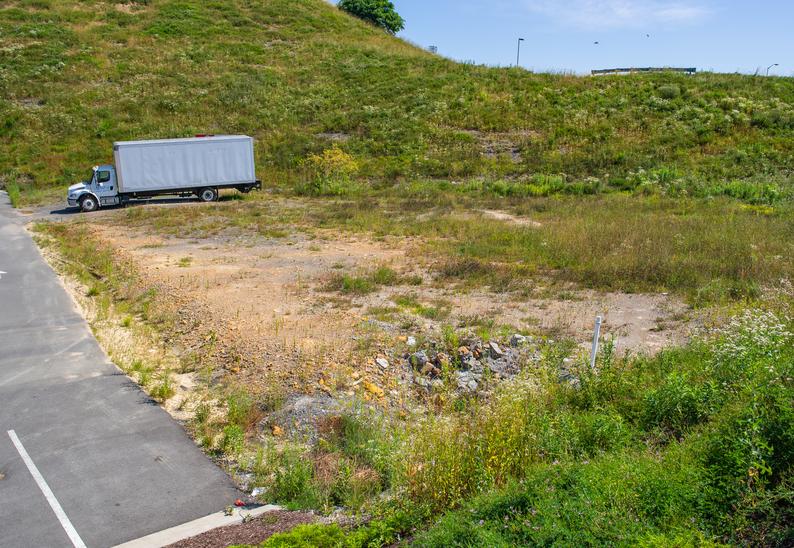
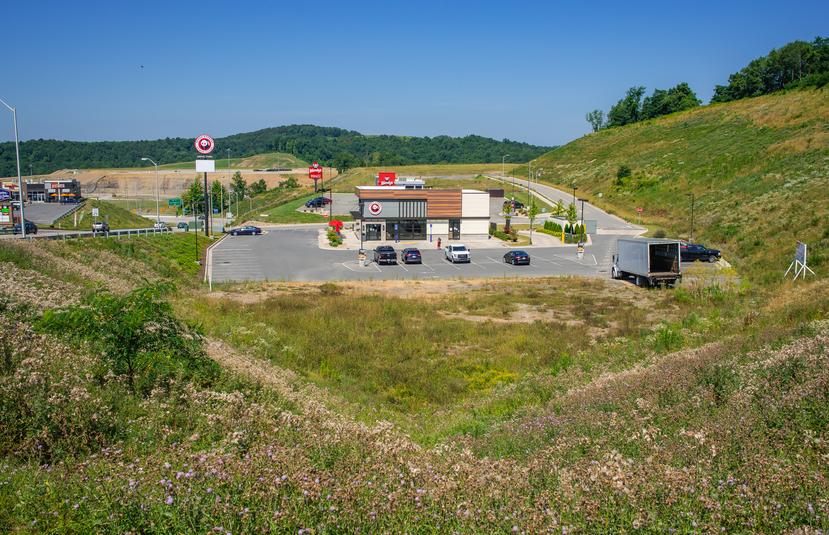
1-Mile | 3-Miles | 5-Miles | ||
---|---|---|---|---|
Total Population | 3,621 | 37,562 | 67,335 | |
Population Median Age | 35 | 34 | 35 | |
Population by Age | 0-9 Yrs | 256 (7%) | 2629 (6%) | 4903 (7%) |
10-19 Yrs | 333 (9%) | 5458 (14%) | 9125 (13%) | |
20-29 Yrs | 1423 (39%) | 13043 (34%) | 21634 (32%) | |
30-39 Yrs | 429 (11%) | 4841 (12%) | 9172 (13%) | |
40-49 Yrs | 207 (5%) | 2566 (6%) | 5859 (8%) | |
50-59 Yrs | 390 (10%) | 3225 (8%) | 6274 (9%) | |
60-69 Yrs | 337 (9%) | 3334 (8%) | 5701 (8%) | |
70+ Yrs | 245 (6%) | 2465 (6%) | 4669 (6%) | |
Median HH Income | $28,993 | $41,305 | $43,600 | |
Total Household Income | < 24K | 492 (40%) | 5186 (35%) | 8472 (32%) |
25-49K | 331 (27%) | 3442 (23%) | 6174 (23%) | |
50-74K | 196 (16%) | 2104 (14%) | 3981 (15%) | |
75-99K | 73 (6%) | 1166 (8%) | 2240 (8%) | |
100-199K | 79 (6%) | 1901 (13%) | 3901 (14%) | |
200K+ | 31 (2%) | 725 (4%) | 1350 (5%) | |
Highest Education Level | No Diploma | 239 | 1711 | 2796 |
Diploma or GED | 797 | 4773 | 9748 | |
Some College | 418 | 3314 | 6414 | |
Assoc. Degree | 59 | 894 | 2152 | |
Bachelors Degree | 128 | 4600 | 8289 | |
Higher Degree | 130 | 5284 | 9562 | |
Total Housing Units | 1,391 | 16,866 | 30,226 | |
--Owner-Occupied | 581 | 5,841 | 11,509 | |
--Renter-Occupied | 621 | 8,682 | 14,609 | |
Owner-Occupied Values | < 100K | 357 | 1194 | 2524 |
100-199K | 141 | 1875 | 3690 | |
200-299K | 65 | 1492 | 3060 | |
300-399K | 15 | 651 | 1151 | |
400-499K | 1 | 268 | 494 | |
500K+ | 3 | 361 | 590 | |
Total Working Age Population | 3,186 | 33,917 | 59,662 | |
In Work Force | 1,840 | 19,598 | 35,450 | |
Not In Work Force | 1,347 | 14,319 | 24,213 | |
Workforce Employed | 1,696 | 18,002 | 32,688 | |
Workforce Unemployed | 144 | 1,576 | 2,722 | |
Civlian Workforce | 1,840 | 19,578 | 35,410 | |
Military Workforce | 0 | 19 | 40 | |
Total Households | 1,202 | 14,523 | 26,117 | |
Family Households | 577 | 5,874 | 11,149 | |
Non-Family Households | 624 | 8,649 | 14,969 | |
Married Couple | 422 | 4,362 | 8,227 | |
Other Family | 155 | 1,512 | 2,922 | |
Married w/Child | 107 | 1,389 | 2,772 | |
Single Male w/Child | 38 | 265 | 518 | |
Single Female w/Child | 31 | 512 | 978 |
Population Change Last Two Decades - Plus Projection
2000 | % | 2010 | % | 2020 | % | 2030 | |
---|---|---|---|---|---|---|---|
West Virginia | 1,808,344 | +2 | 1,852,994 | -1 | 1,828,079 | -1 | 1,806,816 |
Marion County | 56,598 | 0 | 56,418 | +1 | 56,713 | -2 | 55,548 |
Monongalia County | 81,866 | +17 | 96,189 | +14 | 109,410 | +9 | 119,394 |
Total Working Age Population:
Total Households:
Total Working Age Population:
Total Households:
Total Working Age Population:
Total Households: