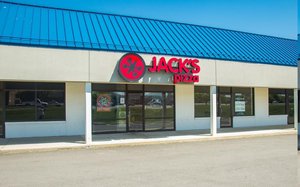
1-Mile | 3-Miles | 5-Miles | ||
---|---|---|---|---|
Total Population | 6,109 | 50,780 | 136,833 | |
Population Median Age | 38 | 37 | 36 | |
Population by Age | 0-9 Yrs | 667 (10%) | 6405 (12%) | 18735 (13%) |
10-19 Yrs | 1061 (17%) | 8152 (16%) | 20920 (15%) | |
20-29 Yrs | 704 (11%) | 6339 (12%) | 18527 (13%) | |
30-39 Yrs | 834 (13%) | 7455 (14%) | 19240 (14%) | |
40-49 Yrs | 756 (12%) | 6963 (13%) | 17959 (13%) | |
50-59 Yrs | 986 (16%) | 6424 (12%) | 17364 (12%) | |
60-69 Yrs | 647 (10%) | 5019 (9%) | 13090 (9%) | |
70+ Yrs | 454 (7%) | 4023 (7%) | 10999 (8%) | |
Median HH Income | $81,406 | $76,637 | $65,442 | |
Total Household Income | < 24K | 153 (7%) | 1724 (9%) | 7106 (14%) |
25-49K | 317 (14%) | 3436 (19%) | 11650 (23%) | |
50-74K | 466 (21%) | 3564 (19%) | 9513 (19%) | |
75-99K | 568 (26%) | 3562 (19%) | 7908 (15%) | |
100-199K | 604 (27%) | 4753 (26%) | 11749 (23%) | |
200K+ | 56 (2%) | 876 (4%) | 2100 (4%) | |
Highest Education Level | No Diploma | 313 | 2300 | 7768 |
Diploma or GED | 1220 | 9748 | 25166 | |
Some College | 751 | 6662 | 18721 | |
Assoc. Degree | 457 | 3090 | 8531 | |
Bachelors Degree | 845 | 7120 | 18543 | |
Higher Degree | 418 | 3727 | 9390 | |
Total Housing Units | 2,299 | 19,159 | 54,158 | |
--Owner-Occupied | 1,642 | 13,834 | 33,635 | |
--Renter-Occupied | 524 | 4,081 | 16,392 | |
Owner-Occupied Values | < 100K | 64 | 1573 | 4462 |
100-199K | 1239 | 8354 | 19151 | |
200-299K | 300 | 2915 | 7136 | |
300-399K | 39 | 817 | 1861 | |
400-499K | 0 | 81 | 460 | |
500K+ | 0 | 94 | 565 | |
Total Working Age Population | 4,946 | 39,525 | 105,221 | |
In Work Force | 3,527 | 28,012 | 74,022 | |
Not In Work Force | 1,419 | 11,514 | 31,199 | |
Workforce Employed | 3,466 | 26,630 | 70,395 | |
Workforce Unemployed | 61 | 1,374 | 3,594 | |
Civlian Workforce | 3,527 | 28,004 | 73,989 | |
Military Workforce | 0 | 7 | 33 | |
Total Households | 2,165 | 17,915 | 50,027 | |
Family Households | 1,709 | 13,113 | 33,361 | |
Non-Family Households | 456 | 4,802 | 16,666 | |
Married Couple | 1,202 | 9,623 | 23,804 | |
Other Family | 507 | 3,491 | 9,557 | |
Married w/Child | 562 | 4,449 | 10,890 | |
Single Male w/Child | 79 | 524 | 1,161 | |
Single Female w/Child | 243 | 1,497 | 4,335 |
Population Change Last Two Decades - Plus Projection
2000 | % | 2010 | % | 2020 | % | 2030 | |
---|---|---|---|---|---|---|---|
Indiana | 6,080,485 | +7 | 6,483,802 | +4 | 6,738,573 | +4 | 7,014,880 |
Hendricks County | 104,093 | +40 | 145,448 | +17 | 170,323 | +16 | 197,902 |
Marion County | 860,454 | +5 | 903,393 | +7 | 963,732 | +4 | 1,001,231 |
Total Working Age Population:
Total Households:
Total Working Age Population:
Total Households:
Total Working Age Population:
Total Households: