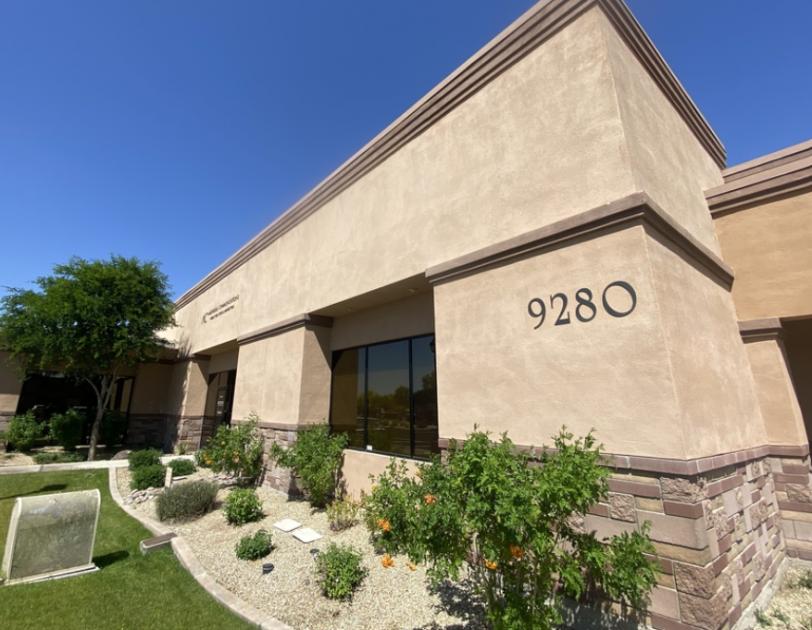
Office Space
9280 East Raintree Drive Scottsdale, AZ 85260
9280 East Raintree Drive Scottsdale, AZ 85260
Details & Description
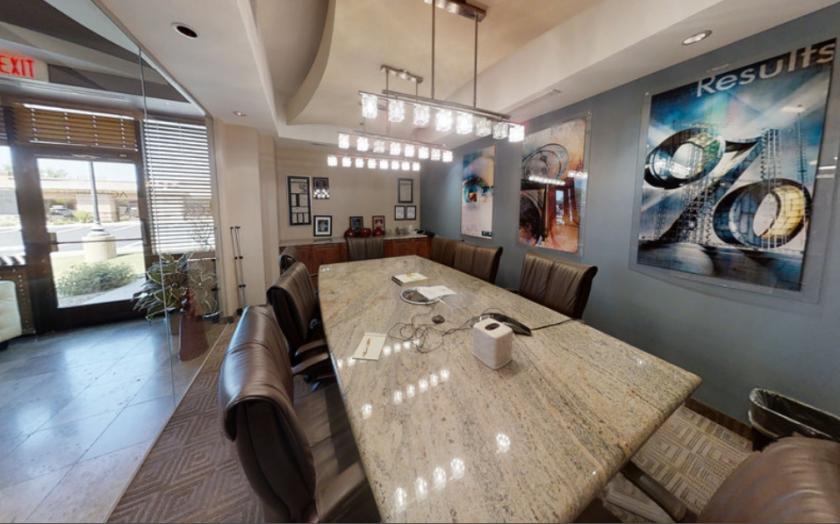
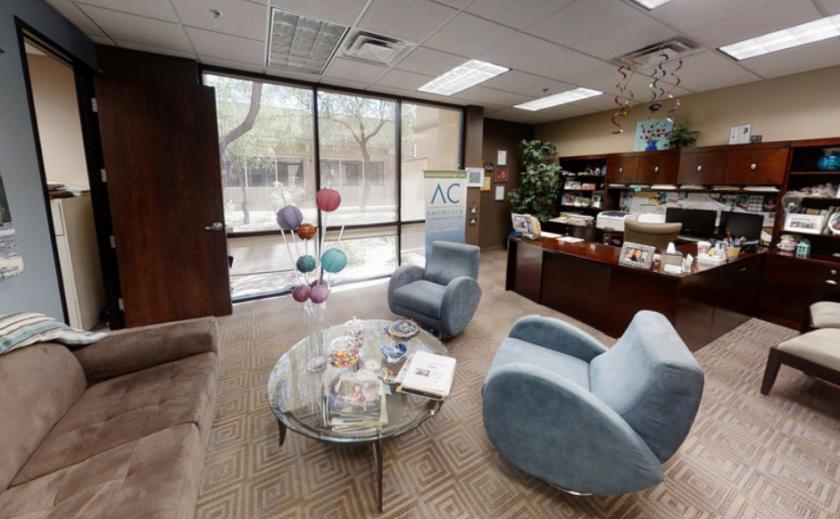
Property Highlights
- • Effortless Pull Up Parking Throughout the Property
- • Incredible OwnerUser Opportunity
- • Prominent Building Signage
- • Tremendous Glass Line
- • Opportunity to be Delivered Fully Furnished
Listing Agents

Zak Kottler
O: 480-294-6003
M: 480-272-1493
zkottler@levrose.com
O: 480-294-6003
M: 480-272-1493
zkottler@levrose.com
While we strive to provide the most accurate information, all listing information, and demographic data, is provided by third-parties. As such, MyEListing will not be responsible for the accuracy of the information. It is strongly recommended that you verify all information with the listing agent, and any relevant agencies, prior to making any decisions.